【GA优化K-means不求人】遗传算法优化Kmeans聚类+MATLAB轻代码
【GA优化K-means不求人】遗传算法优化Kmeans聚类+MATLAB轻代码
- 一、K-means聚类原理介绍
- 二、K-means优化设计要点
- 三、MATLAB实践操作(K-means)
-
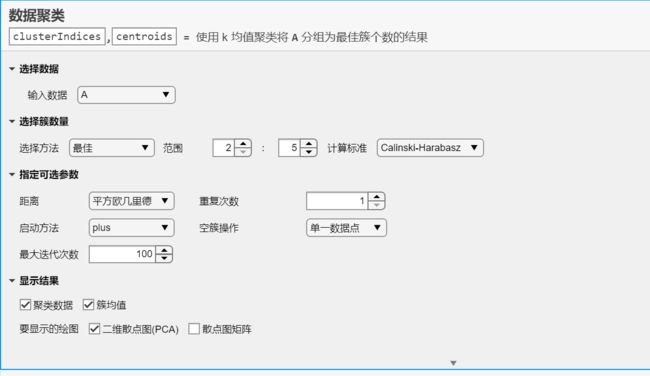
- 实时编辑器自动设置([参考视频教程](https://www.bilibili.com/video/BV1Rr4y1J7yK?share_source=copy_web "参考视频教程"))
- 代码编辑
- 四、MATLAB实践操作(GA优化K-means)
- 五、资料获取
本期资料,关注微信公众号【橙子数据军团】后台回复“K均值””
一、K-means聚类原理介绍
- K-means算法的核心思想是将样本之间距离作为分类标准,事先设定好聚类数k,再通过聚类中心的合理选择,使得同类别中的样本间距离尽可能小。
- 属于无监督学习。
- 动画演示网址
二、K-means优化设计要点
- 聚类数K值的确定
- 初始聚类中心点的确定(GA重点优化选项)
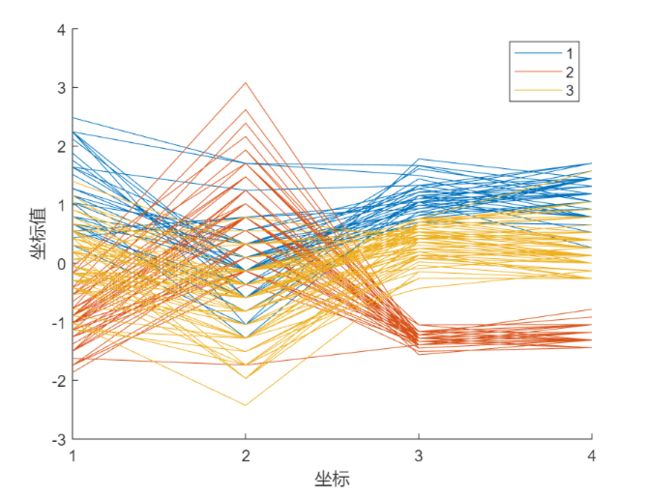
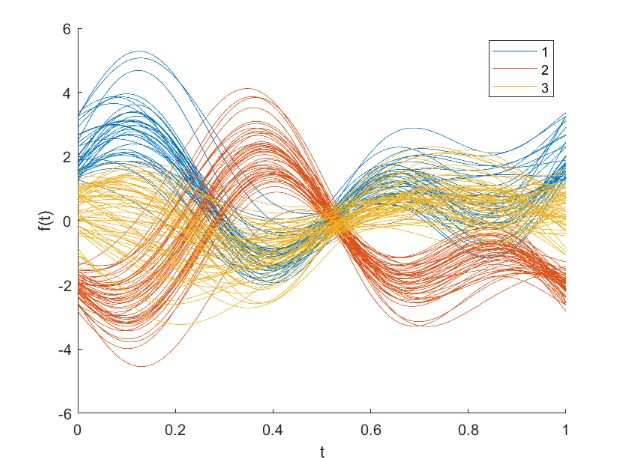
- 聚类效果的可视化(高维数据可视化)
- 多种聚类效果评价指标
三、MATLAB实践操作(K-means)
实时编辑器自动设置(参考视频教程)
代码编辑
- 读取数据
clc;clear;% 清空
A=xlsread('模板数据');
- 确定最佳聚类数K
fh = @(X,K)(kmeans(X,K));
eva = evalclusters(A,fh,"CalinskiHarabasz","KList",2:5);
clear fh
K = eva.OptimalK;
clusterIndices = eva.OptimalY;
- 显示簇计算标准值
figure
bar(eva.InspectedK,eva.CriterionValues);
xticks(eva.InspectedK);
xlabel("Number of clusters");
ylabel("Criterion values - Calinski-Harabasz");
legend("Optimal number of clusters is " + num2str(K))
title("Evaluation of Optimal Number of Clusters")
disp("Optimal number of clusters is " + num2str(K));
- 计算质心
centroids = grpstats(A,clusterIndices,"mean");
- 可视化展示聚类效果
% 使用指定范围选择最佳簇个数(K 值)
fh = @(X,K)(kmeans(X,K));
eva = evalclusters(A,fh,"CalinskiHarabasz","KList",2:5);
clear fh
K = eva.OptimalK;
clusterIndices = eva.OptimalY;

% 显示簇计算标准值
figure
bar(eva.InspectedK,eva.CriterionValues);
xticks(eva.InspectedK);
xlabel("Number of clusters");
ylabel("Criterion values - Calinski-Harabasz");
legend("Optimal number of clusters is " + num2str(K))
title("Evaluation of Optimal Number of Clusters")
disp("Optimal number of clusters is " + num2str(K));
clear eva

% 计算质心
centroids = grpstats(A,clusterIndices,"mean");

% 显示结果

% 显示二维散点图(PCA)
figure
[~,score] = pca(A);
clusterMeans = grpstats(score,clusterIndices,"mean");
h = gscatter(score(:,1),score(:,2),clusterIndices,colormap("lines"));
for i = 1:numel(h)
    h(i).DisplayName = strcat("Cluster",h(i).DisplayName);
end
clear h i score
hold on
h = scatter(clusterMeans(:,1),clusterMeans(:,2),50,"kx","LineWidth",2);
hold off
h.DisplayName = "ClusterMeans";
clear h clusterMeans
legend;
title("First 2 PCA Components of Clustered Data");
xlabel("First principal component");
ylabel("Second principal component");
四、MATLAB实践操作(GA优化K-means)
- 优化后结果可视化
- 聚类结果评价
具体内容参考视频教程
五、资料获取
本期资料,关注微信公众号【橙子数据军团】后台回复“K均值


