matlab绘制三维柱状图(hist3,bar3)
N = 1e3;                  % number of points
rng(7)
signalIn = rand(N, 2)*30;
signalIn(1:10,:) = 5.5;    % 密集
signalIn(51:70,:) = 15.5;  % 密集
[xy_count, xy_cent]=getDist2D(signalIn,2);
[xy_count, xy_cent]=getDist2D(signalIn,2);
%% 三维柱状图
close all
[x15,y15]=size(xy_count);
X15=1:x15;
Y15=1:y15;
figure
% mesh( xy_cent{1}, xy_cent{2},xy_count);
% mesh(Y15,X15,(xy_count));
% imagesc(xy_count)
% % bar3( xy_cent{1}', xy_cent{2}',xy_count);
thisFig=bar3(xy_count);
% ----根据柱子高度设置颜色----
if 0
% https://blog.csdn.net/weixin_40398103/article/details/89380310
for k = 1:length(thisFig)
zdata = thisFig(k).ZData;
%zdata=ones(size(zdata))*0.2; % all use the same color
thisFig(k).CData = zdata;
thisFig(k).FaceColor = 'interp'; % 渐变色
% thisFig(k).FaceColor = 'r';
% thisFig(k).FaceColor = [0.30 0.75 0.93];
% thisFig(k).FaceColor = [0.62 0.91 0.97];
% thisFig(k).FaceColor = [.75,.85,.95]; % Plot the bars in a light steel blue.in hist3
end
% set(gcf,'renderer','opengl');
% set(get(gca,'child'),'FaceColor','interp','CDataMode','auto');
end
% h.XTickLabel =xy_cent{1}; % 直接用会有问题
% h.YTickLabel =(101:1:124);
% set(gca,'xticklabel',{'a','b','c','d','e'});
% set(gca, 'FontSize',12','XTick', (101:106));
% 1、xticklabel:xticklabel是刻度标签。
% 2、xtick:xtick是坐标轴刻度。
% ----改变刻度显示值----
h = gca;
if 1
% https://www.cnblogs.com/fengsf/p/14643905.html
% https://ww2.mathworks.cn/help/matlab/creating_plots/color-3-d-bars-by-height-1.html?searchHighlight=bar3&s_tid=srchtitle
%x的坐标
xt=get(gca,'XTick');
if min(xt)==0
a=1;
else
a=xt(1);
end
if max(xt)>length(xy_cent{1})
b=length(xy_cent{1});
else
b=xt(end);
end
newXIdx=[a xt(2:end-1) b];
newXTickLabel=xy_cent{1}(newXIdx);
h.XTickLabel=newXTickLabel;
% y的坐标
yt=get(gca,'YTick'); % 首0改1,末超用end
newYIdx=[1 yt(2:end-1) length(xy_cent{2})];
newYTickLabel=xy_cent{2}(newYIdx);
h.YTickLabel=newYTickLabel;
end
colorbar
title('分布')
xlabel('x')
ylabel('y')
zlabel('z')
以上是主函数。
2022.12.4 补充getDist2D函数:
function [xy_count, xy_cent]=getDist2D(xy,type,x_range,y_range)

if ~(isreal(xy))
    xy=[real(xy) imag(xy)];
end
N=size(xy,1);
K1 = 64/2;    % number of intervals along x
K2 = 64/2;
% int_x = [min(xy(:,1)) :1/K1: max(xy(:,1))+1/K1];
% int_y = [min(xy(:,2)) :1/K2: max(xy(:,2))+1/K2];
int_x=linspace(min(xy(:,1)) , max(xy(:,1))+1/K1, K1);
int_y=linspace(min(xy(:,2)) , max(xy(:,2))+1/K2, K2);

if nargin > 2
    int_x = x_range;
    int_y = y_range;
end
% K1=length(int_x)-1;
% K2=length(int_y)-1;
K1=length(int_x);
K2=length(int_y);
switch type
    case 1
        %% hist3
        [count_cells_hist,xy_cent] = hist3(xy, 'Edges', {int_x int_y});
        % 注意hist3得到的矩阵是K1+1*K2+1的, 所以把最后一行和一列去掉.
        % 最后一行或一列表示的是 X(k,1)= edges{1}(end)或者X(k,2) = edges{2}(end)的点数
        xy_count=count_cells_hist;
    case 2
        %% histcounts2
        [xy_count,Xedges,Yedges] = histcounts2(xy(:,1),xy(:,2),int_x,int_y);
        %         [N,Xedges,Yedges] = histcounts2(x,y,6,'Normalization','probability')
        %         [N,Xedges,Yedges] = histcounts2(x,y,6,'Normalization','pdf')
        %          all(count_cells_hist(:) == xy_count(:))
        xy_cent{1}=Xedges;
        xy_cent{2}=Yedges;
        xy_cent{1}(end) = [];
        xy_cent{2}(end) = [];
end
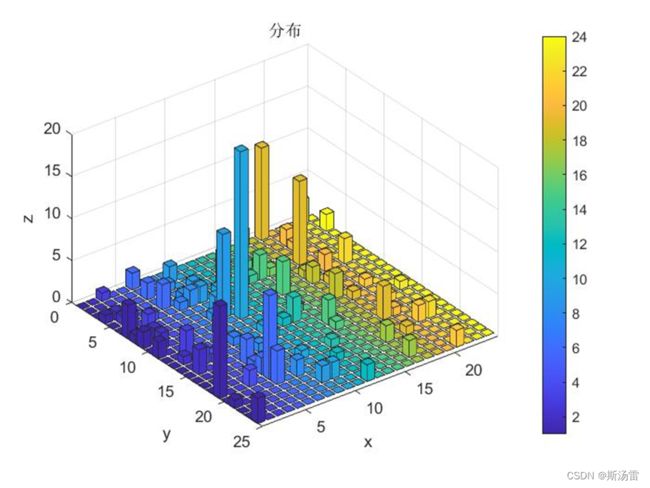
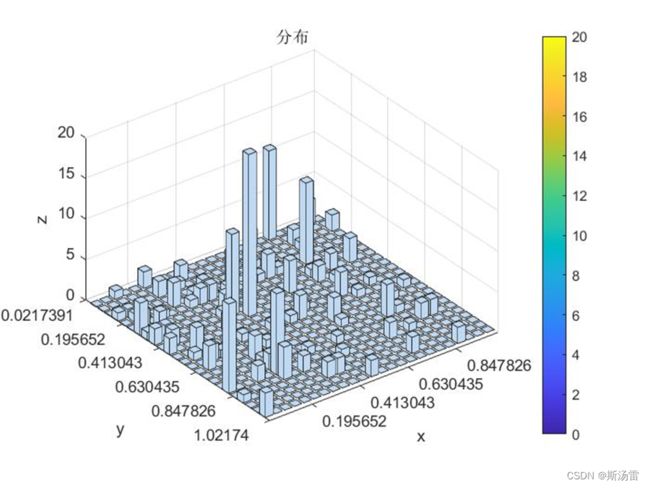
源数据无了,使用rng(7)生成随机数据,绘制的分布图如下


