基于R语言利用CIBERSORT分析免疫浸润(二)
引言:本节重点
(1)在我写(一)的时候,很多小伙伴相信直接使用遇到了很多问题,本节就主要遇到问题进行回答:
①R包版本问题
②Data数据格式问题
③CIBERSORT官方代码问题
并将附上全部代码
(2)此外,本节将介绍分析后的数据常见的可视化方式
一、问题解决
1、R包版本问题
相信很多人都会遇到这个问题。如“这个R包版本不适用于该版本R”、“连接错误”、“依赖包安装无效或版本不足”等等。这时候通常解决办法两种:
(1)重装R和Studio,但这样就显得过于麻烦了。
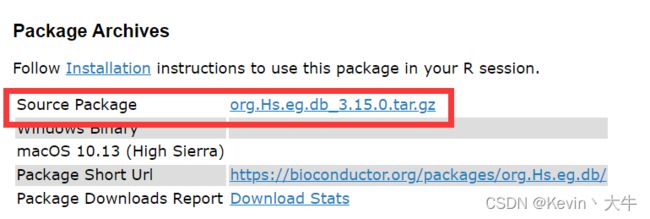
(2)相信第二种办法很多人就愿意去尝试了。一个是利用R官网提供的R包下载路径,通过自己下载tar.zip文件导入R中;二是在BiocConductor官网下载R包的tar.zip文件,同样导入R中,我通常采用的该方法。(该方法将在第二个问题进行一个图示讲解)
2、Data数据格式问题
很多人使用CIBERSORT方法的时候,是没有注意Data和LM22两套数据的,因此极其容易发生错误,最需要注意的地方之一就是LM22的行名是ENTREZ ID,如果Data的行名是GENE SYMBOL是不是就无法进行计算了呢?答案是肯定的,所以我们就需要将Data的行名改为ENTREZ ID。具体操作如下
①下载并导入安装包(因为R无法使用install.packages和BiocManager::install下载)
https://www.bioconductor.org/packages/release/data/annotation/html/org.Hs.eg.db.html
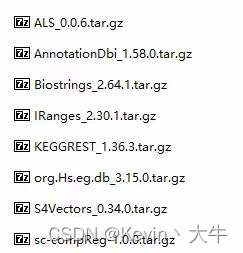
当然,这一个是不够的,你需要下载这么多
②使用以下代码替换GENE SYMBOL
library(org.Hs.eg.db)
library(clusterProfiler)
gene.df <- bitr(rownames(data), fromType = "SYMBOL",
                toType = c("ENTREZID"),
                OrgDb = org.Hs.eg.db)
data <- data[which(rownames(data) %in% gene.df[,1]),]
rownames(data) <- gene.df[,2]
3、CIBERSORT官方代码问题
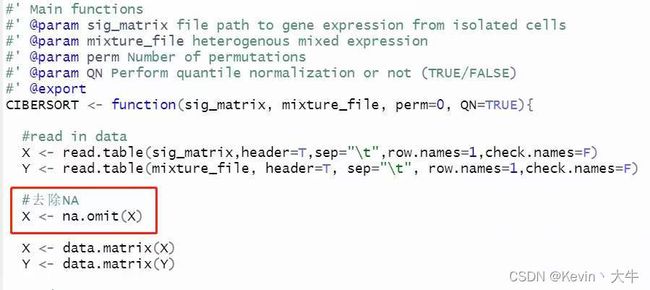
第一个问题是CIBERSORT没有考虑到LM22数据中有NA的问题,因此会导致运行的时候R直接挂掉。所以我们需要在官方代码的主函数CIBERSORT()中添加这句话。
第二个问题就很奇怪了,如果调用CIBERSORT()这个函数总是会报Model is empty!但是在我一句话一句话检查的时候就没有,因此我直接把CIBERSORT()主函数去掉,咱们直接一句一句运行即可。最终所有代码如下
library(dplyr)
library(limma)
setwd("D:\\工作文件\\CSDN\\CINBERSORT(x)\\示例数据")
rm(list = ls())
####读入数据####
#表达谱数据
data <- read.table(".\\GSE数据\\GSE159661_series_matrix.txt", sep = "\t",
                   comment.char = "!", fill = T)
colnames(data) <- data[1,]
data <- data[-1,]
#注释数据
meta <- read.table(".\\GPL数据\\GPL21185-21174.txt", sep = "\t",
                   comment.char = "#", fill = T)
colnames(meta) <- meta[1,]
meta <- meta[-1,]
####注释数据####
#合并信息
colnames(data)[1] <- "ID"
meta <- meta[,c(1,6)]
data <- merge(data, meta, by = "ID")
data <- data[!is.na(data$GENE_SYMBOL),]
data <- data[data$GENE_SYMBOL != "",]
#相同基因取均值
GENE_SYMBOL <- data$GENE_SYMBOL
data <- data[,-c(1,14)]
data <- lapply(data, as.numeric) %>% as.data.frame(.)
data <- aggregate(.~GENE_SYMBOL,data = data, mean)
rownames(data) <- data[,1]
data <- data[,-1]
#对照信息
group <- c("sensitive","resistant","resistant",
           "resistant","sensitive","resistant",
           "sensitive","resistant","resistant",
           "resistant","sensitive","resistant") %>% factor(, levels = c("resistant","sensitive"), ordered = F)
#Entrez id信息
library(org.Hs.eg.db)
library(clusterProfiler)
gene.df <- bitr(rownames(data), fromType = "SYMBOL",
                toType = c("ENTREZID"),
                OrgDb = org.Hs.eg.db)
data <- data[which(rownames(data) %in% gene.df[,1]),]
rownames(data) <- gene.df[,2]
####数据预处理####
#log2转换
# data <- log2(data)
####差异分析####
group <- model.matrix(~factor(group)+0)
colnames(group) <- c("resistant","sensitive")
df.fit <- lmFit(data, group)
df.matrix <- makeContrasts(resistant - sensitive, levels = group)
fit <- contrasts.fit(df.fit, df.matrix)
fit <- eBayes(fit)
tempOutput <- topTable(fit, n = Inf, adjust = "fdr")
diffGene <- rownames(tempOutput)[which(abs(tempOutput$logFC) > 1 & tempOutput$adj.P.Val < 0.05)]
# data <- data[(rownames(data) %in% diffGene),]
write.table(data, "Data.txt", sep = "\t", row.names = T, col.names = T)
####Cibersort分析####
rm(list = ls())
source("D:\\工作文件\\CSDN\\CINBERSORT(x)\\CIBERSORT.R")
result <- CIBERSORT()
rm(list = ls())
####Cibersort分析####
#' @param X cell-specific gene expression
#' @param y mixed expression per sample
#' @export
CoreAlg <- function(X, y){

  #try different values of nu
  svn_itor <- 3

  res <- function(i){
    if(i==1){nus <- 0.25}
    if(i==2){nus <- 0.5}
    if(i==3){nus <- 0.75}
    model<-e1071::svm(X,y,type="nu-regression",kernel="linear",nu=nus,scale=F)
    model
  }

  if(Sys.info()['sysname'] == 'Windows') out <- parallel::mclapply(1:svn_itor, res, mc.cores=1) else
    out <- parallel::mclapply(1:svn_itor, res, mc.cores=svn_itor)

  nusvm <- rep(0,svn_itor)
  corrv <- rep(0,svn_itor)

  #do cibersort
  t <- 1
  while(t <= svn_itor) {
    weights = t(out[[t]]$coefs) %*% out[[t]]$SV
    weights[which(weights<0)]<-0
    w<-weights/sum(weights)
    u <- sweep(X,MARGIN=2,w,'*')
    k <- apply(u, 1, sum)
    nusvm[t] <- sqrt((mean((k - y)^2)))
    corrv[t] <- cor(k, y)
    t <- t + 1
  }

  #pick best model
  rmses <- nusvm
  mn <- which.min(rmses)
  model <- out[[mn]]

  #get and normalize coefficients
  q <- t(model$coefs) %*% model$SV
  q[which(q<0)]<-0
  w <- (q/sum(q))

  mix_rmse <- rmses[mn]
  mix_r <- corrv[mn]

  newList <- list("w" = w, "mix_rmse" = mix_rmse, "mix_r" = mix_r)

}

#' do permutations
#' @param perm Number of permutations
#' @param X cell-specific gene expression
#' @param y mixed expression per sample
#' @export
doPerm <- function(perm, X, Y){
  itor <- 1
  Ylist <- as.list(data.matrix(Y))
  dist <- matrix()

  while(itor <= perm){
    #print(itor)

    #random mixture
    yr <- as.numeric(Ylist[sample(length(Ylist),dim(X)[1])])

    #standardize mixture
    yr <- (yr - mean(yr)) / sd(yr)

    #run CIBERSORT core algorithm
    result <- CoreAlg(X, yr)

    mix_r <- result$mix_r

    #store correlation
    if(itor == 1) {dist <- mix_r}
    else {dist <- rbind(dist, mix_r)}

    itor <- itor + 1
  }
  newList <- list("dist" = dist)
}

#' Main functions
#' @param sig_matrix file path to gene expression from isolated cells
#' @param mixture_file heterogenous mixed expression
#' @param perm Number of permutations
#' @param QN Perform quantile normalization or not (TRUE/FALSE)
#' @export

perm = 999
QN = T
#read in data
X <- read.table("D:\\工作文件\\CSDN\\CINBERSORT(x)\\LM22\\LM22.txt",header=T,sep="\t",row.names=1,check.names=F)
Y <- read.table("D:\\工作文件\\CSDN\\CINBERSORT(x)\\示例数据\\Data.txt", header=T, sep="\t", row.names=1,check.names=F)

#去除NA
X <- na.omit(X)

X <- data.matrix(X)
Y <- data.matrix(Y)

#order
X <- X[order(rownames(X)),]
Y <- Y[order(rownames(Y)),]

P <- perm #number of permutations

#anti-log if max < 50 in mixture file
if(max(Y) < 50) {Y <- 2^Y}

#quantile normalization of mixture file
if(QN == TRUE){
  tmpc <- colnames(Y)
  tmpr <- rownames(Y)
  Y <- preprocessCore::normalize.quantiles(Y)
  colnames(Y) <- tmpc
  rownames(Y) <- tmpr
}

#intersect genes
Xgns <- row.names(X)
Ygns <- row.names(Y)
YintX <- Ygns %in% Xgns
Y <- Y[YintX,]
XintY <- Xgns %in% row.names(Y)
X <- X[XintY,]

#standardize sig matrix
X <- (X - mean(X)) / sd(as.vector(X))

#empirical null distribution of correlation coefficients
if(P > 0) {nulldist <- sort(doPerm(P, X, Y)$dist)}

#print(nulldist)

header <- c('Mixture',colnames(X),"P-value","Correlation","RMSE")
#print(header)

output <- matrix()
itor <- 1
mixtures <- dim(Y)[2]
pval <- 9999

#iterate through mixtures
while(itor <= mixtures){

  y <- Y[,itor]

  #standardize mixture
  y <- (y - mean(y)) / sd(y)

  #run SVR core algorithm
  result <- CoreAlg(X, y)

  #get results
  w <- result$w
  mix_r <- result$mix_r
  mix_rmse <- result$mix_rmse

  #calculate p-value
  if(P > 0) {pval <- 1 - (which.min(abs(nulldist - mix_r)) / length(nulldist))}

  #print output
  out <- c(colnames(Y)[itor],w,pval,mix_r,mix_rmse)
  if(itor == 1) {output <- out}
  else {output <- rbind(output, out)}

  itor <- itor + 1

}

#save results
write.table(rbind(header,output), file="CIBERSORT-Results.txt", sep="\t", row.names=F, col.names=F, quote=F)

#return matrix object containing all results
obj <- rbind(header,output)
obj <- obj[,-1]
obj <- obj[-1,]
obj <- matrix(as.numeric(unlist(obj)),nrow=nrow(obj))
rownames(obj) <- colnames(Y)
colnames(obj) <- c(colnames(X),"P-value","Correlation","RMSE")
obj
二、数据可视化
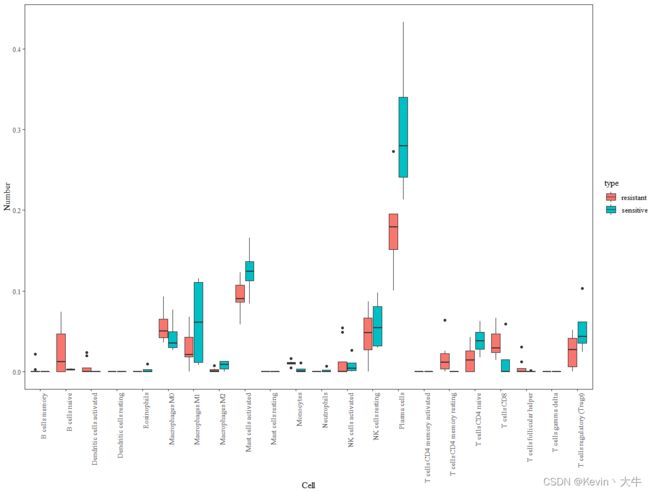
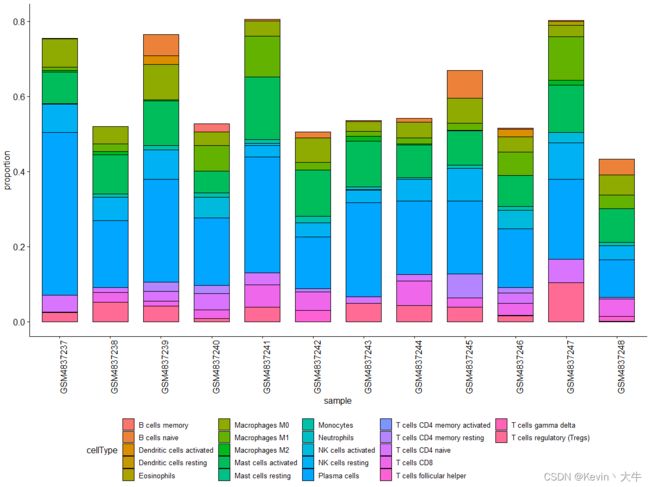
这里主要讲解两个比较常用的可视化呈现方式,第一种是基于对照的箱线图(ggplot2包),第二种是基于组成的直方图(ggpubr包)。这里采用最粗暴的讲解方式:代码+图示结果!
1、箱线图:主要用到的函数是ggplot,废话不多说,代码和结果如下
library(ggplot2)
library(ggpubr)
####数据可视化####
group <- c("sensitive","resistant","resistant",
           "resistant","sensitive","resistant",
           "sensitive","resistant","resistant",
           "resistant","sensitive","resistant") %>% factor(, levels = c("resistant","sensitive"), ordered = F)
obj <- as.data.frame(obj)
obj <- cbind(obj, group)
obj$Sample <- rownames(obj)
cell <- data.frame(type = "", cellType = "", proportion = 0)
for(i in 3:24){
  part <- aggregate(obj[,i], list(obj$group), function(x){x})[,2]
  for(m in part[[1]]){
    cell <- rbind(cell, data.frame(type = "resistant", cellType = colnames(obj)[i], proportion = m))
  }
  for(n in part[[2]]){
    cell <- rbind(cell, data.frame(type = "sensitive", cellType = colnames(obj)[i], proportion = n))
  }
}
cell <- cell[-1,]
ggplot(cell, aes(x = cellType, y = proportion, fill = type))+
  geom_boxplot()+
  ggtitle(NULL)+
  labs(x = "Cell", y = "Number")+
  theme_set(theme_bw())+
  theme(panel.grid.major = element_line(colour = NA),
        panel.grid.minor = element_blank(),
        text=element_text(size = 12, family = "serif"),
        axis.text.x = element_text(angle = 90, hjust = 1))
2、直方图:主要函数是ggbarplot。
sample <- data.frame(sample = "", proportion = 0, cellType = "")
for(i in 3:24){
  part <- aggregate(obj[,i], list(obj$Sample), function(x){x})
  part$cellType <- colnames(obj)[i]
  colnames(part) <- c("sample", "proportion", "cellType")
  sample <- rbind(sample, part)
}
sample <- sample[-1,]
ggbarplot(sample, x = "sample", y= "proportion", fill = "cellType")+
  theme(axis.text.x = element_text(angle = 90,hjust = 1,vjust = 1,size = 12),
        legend.position = "bottom")
