RNA 20. SCI 文章中单样本免疫浸润分析 (ssGSEA)

点击关注,桓峰基因
桓峰基因
生物信息分析,SCI文章撰写及生物信息基础知识学习:R语言学习,perl基础编程,linux系统命令,Python遇见更好的你
85篇原创内容
公众号
这期讲讲单样本基因富集分析,这个也蛮有意思的之前我已经介绍过基因集富集分析(GSEA),但是当时是用差异基因来分析,这期我们就通过单基因免疫浸润的方法来介绍一下。

ssgsea<-gsva(as.matrix(expMatrix), geneSets, method = "ssgsea",
min.sz = 10)
ssgsea[1:3, 1:2]##                      TCGA-3L-AA1B-01A-11R-A37K-07 TCGA-4N-A93T-01A-11R-A37K-07## Activated B cell                        0.4251134                    0.3742325## Activated CD4 T cell                    0.5324122                    0.5193579## Activated CD8 T cell                    0.6129071                    0.5807931
4. 结果展示
我们可以对数据进一步的通过图形展示,包括火山图和热图,清晰的看到免疫细胞的分组。
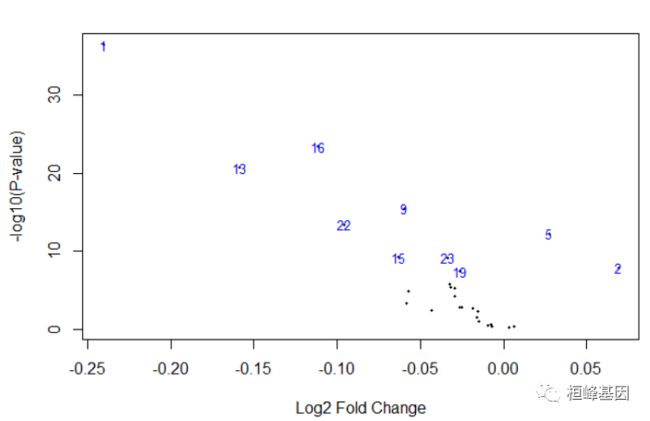
免疫浸润火山图
对免疫细胞做差异分析,由于我们获得的矩阵是非整数型的,所以我们选择limma计算差异,如下:
DEA.ssgsea <- TCGAanalyze_DEA(mat1 = ssgsea[, group[group$Group == "NT", ]$Sample],
    mat2 = ssgsea[, group[group$Group == "TP", ]$Sample], metadata = FALSE, pipeline = "limma",
    Cond1type = "NT", Cond2type = "TP", fdr.cut = 0.05, logFC.cut = 2, )
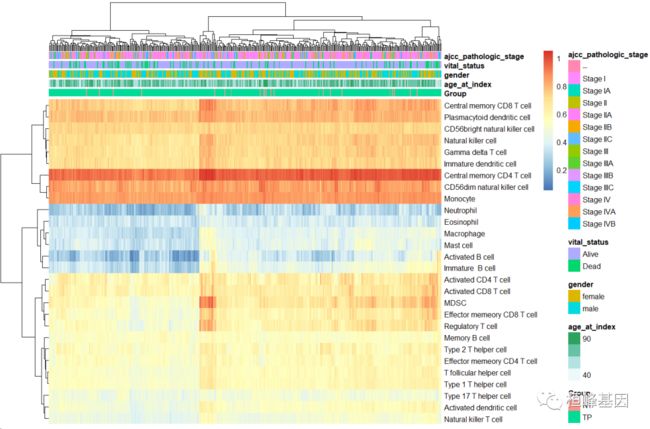
免疫浸润热图
读取临床数据,并选择有效的临床信息,如下:
rowclin <- read.table("clinical.tsv", header = 1, check.names = F, sep = "\t")
clin <- data.frame(rowclin[, c(2, 4, 12, 16, 28)])
clin <- clin[!duplicated(clin$case_submitter_id), ]
head(clin)
##    case_submitter_id age_at_index gender vital_status ajcc_pathologic_stage
## 1       TCGA-G4-6307           37 female        Alive            Stage IIIB
## 3       TCGA-AA-3522           67   male        Alive             Stage IIA
## 5       TCGA-AA-3530           80   male        Alive               Stage I
## 7       TCGA-AA-3511           64   male        Alive              Stage II
## 9       TCGA-AA-3842           51   male        Alive            Stage IIIA
## 11      TCGA-AA-3561           72   male        Alive             Stage IIA
colnames(ssgsea) = substr(colnames(ssgsea), 1, 12)
group$Sample = substr(group$Sample, 1, 12)
head(group)
##         Sample Group
## 1 TCGA-D5-6530    TP
## 2 TCGA-G4-6320    TP
## 3 TCGA-AD-6888    TP
## 4 TCGA-CK-6747    TP
## 5 TCGA-AA-3975    TP
## 6 TCGA-A6-6780    TP
clin_group = merge(group, clin, by.x = "Sample", by.y = "case_submitter_id")
head(clin_group)
##         Sample Group age_at_index gender vital_status ajcc_pathologic_stage
## 1 TCGA-3L-AA1B    TP           61 female        Alive               Stage I
## 2 TCGA-4N-A93T    TP           67   male        Alive            Stage IIIB
## 3 TCGA-4T-AA8H    TP           42 female        Alive             Stage IIA
## 4 TCGA-5M-AAT4    TP           74   male         Dead              Stage IV
## 5 TCGA-5M-AAT6    TP           40 female         Dead              Stage IV
## 6 TCGA-5M-AATE    TP           76   male        Alive             Stage IIA
table(clin_group$Group)
##
##  NT  TP
##  41 469
clin_group <- clin_group[!duplicated(clin_group$Sample), ]
ann_col <- clin_group[, 2:6]
rownames(ann_col) <- clin_group$Sample
# names(ann_col)=c('TNM Stage','Cluster')
head(ann_col)
##              Group age_at_index gender vital_status ajcc_pathologic_stage
## TCGA-3L-AA1B    TP           61 female        Alive               Stage I
## TCGA-4N-A93T    TP           67   male        Alive            Stage IIIB
## TCGA-4T-AA8H    TP           42 female        Alive             Stage IIA
## TCGA-5M-AAT4    TP           74   male         Dead              Stage IV
## TCGA-5M-AAT6    TP           40 female         Dead              Stage IV
## TCGA-5M-AATE    TP           76   male        Alive             Stage IIA
绘制火山图,并添加临床信息,如下:
pheatmap(
  ssgsea[,clin_group$Sample],
  show_colnames = F,
  # 不展示行名
  cluster_rows = T,
  # 不对行聚类
  cluster_cols = T,
  # 不对列聚类
  annotation_col = ann_col,
  # 加注释
  # cellwidth = 5,
  #cellheight = 5,
  # 设置单元格的宽度和高度
  fontsize = 8
)
结果解读
从差异分析的结果图上我们能看到28种免疫细胞的差异,而热图中可将28种细胞分为三大类。
桓峰基因公众号,可以做RNA系列分析,都是SCI级别分析方法,今天刚好整理了一下:
RNA 1. 基因表达那些事–基于 GEO
RNA 2. SCI文章中基于GEO的差异表达基因之 limma
RNA 3. SCI 文章中基于T CGA 差异表达基因之 DESeq
RNA 4. SCI 文章中基于TCGA 差异表达之 edgeR
RNA 5. SCI 文章中差异基因表达之 MA 图
RNA 6. 差异基因表达之-- 火山图 (volcano)
RNA 7. SCI 文章中的基因表达——主成分分析 (PCA)
RNA 8. SCI文章中差异基因表达–热图 (heatmap)
RNA 9. SCI 文章中基因表达之 GO 注释
RNA 10. SCI 文章中基因表达富集之–KEGG
RNA 11. SCI 文章中基因表达富集之 GSEA
RNA 12. SCI 文章中肿瘤免疫浸润计算方法之 CIBERSORT
RNA 13. SCI 文章中差异表达基因之 WGCNA
RNA 14. SCI 文章中差异表达基因之 蛋白互作网络 (PPI)
RNA 15. SCI 文章中的融合基因之 FusionGDB2
RNA 16. SCI 文章中的融合基因之可视化
RNA 17. SCI 文章中的筛选 Hub 基因 (Hub genes)
RNA 18. SCI 文章中基因集变异分析 GSVA
RNA 19. SCI 文章中无监督聚类法 (ConsensusClusterPlus)
RNA 20. SCI 文章中单样本免疫浸润分析 (ssGSEA)
我们每周都会推出1-2篇可以直接使用公众号生信分析方法进行文章的复现,关注桓峰基因,科研路上不迷路,想做科研没思路,加我微信获得最快的资讯!

References:
-
Bindea C, Mlecnik B,Tosolini M, Kirilovsky A, Waldner M, Obenauf AC, et al. Spatiotemporal dynamics of intratumoral immune cells reveal the immune landscape in human cancer. lmmunity. 2013;39(4):782-95.
-
Charoentong P, Finotello F, Angelova M, et al. Pan-cancer Immunogenomic Analyses Reveal Genotype-Immunophenotype Relationships and Predictors of Response to Checkpoint Blockade. Cell Rep. 2017;18(1):248-262. doi:10.1016/j.celrep.2016.12.019
-
Barbie DA, Tamayo P, Boehm JS, et al. Systematic RNA interference reveals that oncogenic KRAS-driven cancers require TBK1. Nature. 2009;462(7269):108-112. doi:10.1038/nature08460
-
Xiao B, Liu L, Li A, et al. Identification and Verification of Immune-Related Gene Prognostic Signature Based on ssGSEA for Osteosarcoma. Front Oncol. 2020;10:607622. Published 2020 Dec 15. doi:10.3389/fonc.2020.607622