机器学习-数据科学库 11 泰坦尼克号生还情况案例
数据准备
参考:https://github.com/datasciencedojo/datasets/blob/master/titanic.csv
import numpy as np
import pandas as pd
from pandas import Series,DataFrame
import matplotlib.pyplot as plt
from __future__ import division
from scipy import stats
import seaborn as sns
import pandas as pd

# 将数据框命名为drinks
titanic_df = pd.read_csv("titanic-data.csv")
字段含义:
- PassengerId:乘客ID
- Survived:是否获救,用1和Rescued表示获救,用0或者not saved表示没有获救
- Pclass:乘客等级,“1”表示Upper,“2”表示Middle,“3”表示Lower
- Name:乘客姓名
- Sex:性别
- Age:年龄
- SibSp:乘客在船上的配偶数量或兄弟姐妹数量)
- Parch:乘客在船上的父母或子女数量
- Ticket:船票信息
- Fare:票价
- Cabin:是否住在独立的房间,“1”表示是,“0”为否
- embarked:表示乘客上船的码头距离泰坦尼克出发码头的距离,数值越大表示距离越远
- S (644)
- C (168)
- Q (77)
参考:https://databasic.io/en/wtfcsv/results/5ea9f0189f0b5700b90e29ad
预处理
填充缺失信息
# 基本信息
print(titanic_df.head())
print(titanic_df.info())
print(titanic_df.describe())

# 填充缺失值 Embarked:众数"S"填充,因为这里缺失的值相比而言非常的少
titanic_df["Embarked"] = titanic_df["Embarked"].fillna("S")

# 填充缺失值 Age:平均值填充,缩小年龄差异
age_mean = titanic_df["Age"].mean()
titanic_df["Age"] = titanic_df["Age"].fillna(age_mean)

# 删除缺失列 Cabin
titanic_df = titanic_df.copy()
del titanic_df["Cabin"]

# 获取生还乘客的数据
def get_survives_passenger_df(df):
    return titanic_df[titanic_df["Survived"] == 1]

survives_passenger_df = get_survives_passenger_df(titanic_df)
工具方法抽象
# 按照name对乘客进行分组,计算每组的人数
def group_passenger_count(data, name):
    # 按照xx对乘客进行分组后 ,每个组的人数
    return data.groupby(name)["PassengerId"].count()


# 计算每个组的生还率
def group_passenger_survived_rate(xx):
    # 按xx对乘客进行分组后每个组的人数
    group_all = group_passenger_count(titanic_df, xx)

    # 对乘客进行分组后每个组生还者的人数
    group_survived_value = group_passenger_count(survives_passenger_df, xx)

    # 对乘客进行分组后,每组生还者的概率
    return group_survived_value / group_all


# 绘制饼图
def print_pie(group_data, title):
    group_data.plot.pie(title=title, figsize=(6, 6), autopct="%.2f%%", startangle=90, legend=True)


# 绘制百分比柱状图
def print_bar(data, title):
    bar = data.plot.bar(title=title)
    for p in bar.patches:
        bar.annotate("%.1f%%" % (p.get_height() * 100), (p.get_x() * 1.005, p.get_height() * 1.005))


# 输出柱状图显示总计
def print_bar_count(data, title):
    bar = data.plot.bar(title=title)
    for p in bar.patches:
        bar.annotate("%.f" % (p.get_height()), (p.get_x() * 1.005, p.get_height() * 1.005))
数据分析
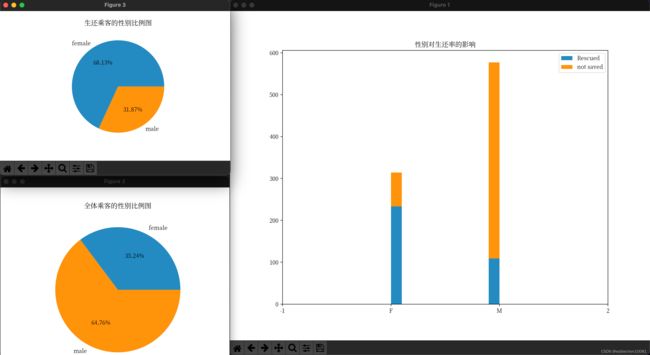
性别是否会影响生还率
# 性别对生还率的影响
df_sex1 = titanic_df["Sex"][titanic_df["Survived"] == 1]
df_sex0 = titanic_df["Sex"][titanic_df["Survived"] == 0]
plt.hist([df_sex1, df_sex0],
         stacked=True,
         label=["Rescued", "not saved"])
plt.xticks([-1, 0, 1, 2], [-1, "F", "M", 2])
plt.legend()
plt.title("性别对生还率的影响")

# 全体乘客的性别比例图
plt.figure()
by_sex = titanic_df.groupby("Sex")["Sex"].count()
plt.pie(by_sex, labels=["female", "male"], autopct="%.2f%%")
plt.title("全体乘客的性别比例图")

# 生还乘客的性别比例图
plt.figure()
by_survived_sex = titanic_df[titanic_df["Survived"] == 1]
by_survived_sex_rate = by_survived_sex.groupby("Sex")["Sex"].count()
plt.pie(by_survived_sex_rate, labels=["female", "male"], autopct="%.2f%%")
plt.title("生还乘客的性别比例图")
得出结论:看出全体乘客中男性占了大部分,但是生还乘客中女性占了大部分;女性的生还概率比男性的更高。
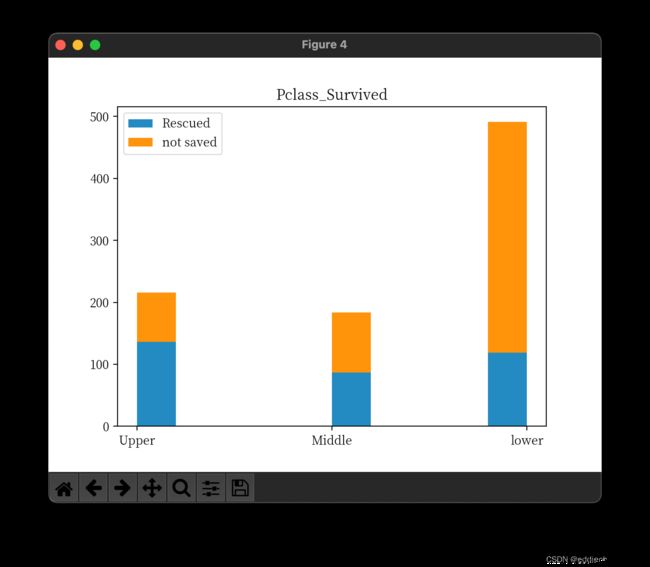
乘客等级对生还率的影响
plt.figure()
df_sex1 = titanic_df['Pclass'][titanic_df['Survived'] == 1]
df_sex0 = titanic_df['Pclass'][titanic_df['Survived'] == 0]
plt.hist([df_sex1, df_sex0],
         stacked=True,
         label=['Rescued', 'not saved'])
plt.xticks([1, 2, 3], ['Upper', 'Middle', 'lower'])
plt.legend()
plt.title('乘客等级对生还率的影响')
全体乘客中lower等级的乘客超过了一半,生还乘客中upper等级的人最多,对比各个等级的死亡人数和生还人数可以得出结论:Upper等级生还概率大于Middle、lower的生存概率,等级越好生还概率越好。
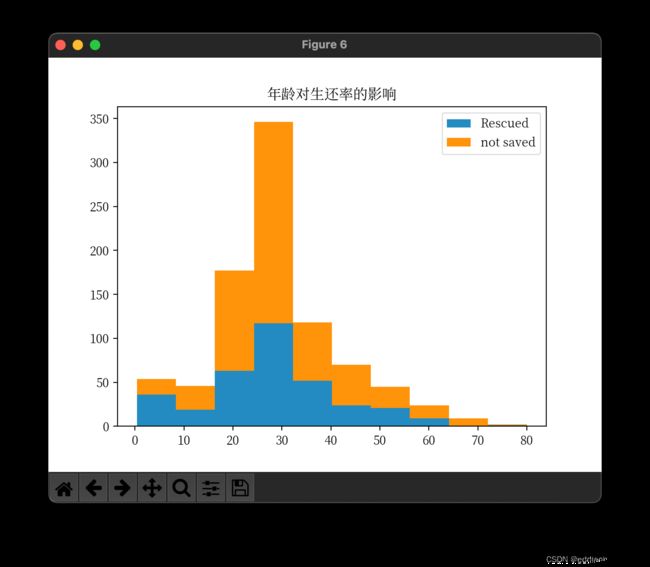
年龄对生还率的影响
plt.figure()
df_sex1 = titanic_df['Age'][titanic_df['Survived'] == 1]
df_sex0 = titanic_df['Age'][titanic_df['Survived'] == 0]
plt.hist([df_sex1, df_sex0],
         stacked=True,
         label=['Rescued', 'not saved'])
plt.title('年龄对生还率的影响')
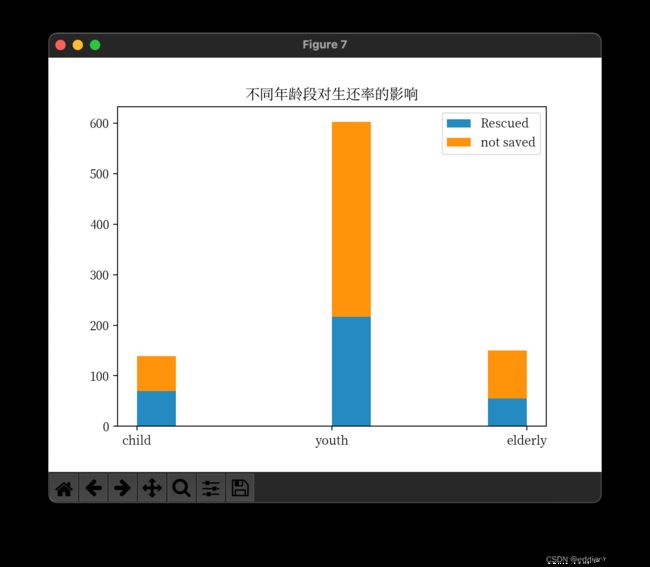
# 不同年龄段对生还率的影响elderly,child,youth
# 年龄数据进行处理,0-18为child(少年),18-40为youth(青年),40-80为elderly(老年)
def age_interval(age):
    if age <= 18:
        return 1
    elif age <= 40:
        return 2
    else:
        return 3


plt.figure()
titanic_df['Age'] = titanic_df['Age'].apply(lambda x: age_interval(x))
df_sex1 = titanic_df['Age'][titanic_df['Survived'] == 1]
df_sex0 = titanic_df['Age'][titanic_df['Survived'] == 0]
plt.hist([df_sex1, df_sex0],
         stacked=True,
         label=['Rescued', 'not saved'])
plt.xticks([1, 2, 3], ['child', 'youth', 'elderly'])
plt.legend()
plt.title('不同年龄段对生还率的影响')
结论:
- 全部乘客中大部分人否在30岁左右,而0-10的生还率比其他年龄段都要高
- 0-10岁的生还率最高,20-40之间的生还人数最多
多因素分析
定义几个常用的方法
# 按照xx(列名)对乘客进行分组,计算每组的人数
def xx_group_all(df,xx):
    #按照xx对乘客进行分组后 ,每个组的人数
    return df.groupby(xx)['PassengerId'].count()

# 计算每个组的生还率
def group_passenger_survived_rate(xx):
    # 按xx对乘客进行分组后每个组的人数
    group_all=xx_group_all(df,xx)

    # 按xx对乘客进行分组后每个组生还者的人数
    group_survived_value=xx_group_all(survives_passenger_df,xx)

    # 按xx对乘客进行分组后,每组生还者的概率
    return group_survived_value/group_all

# 输出饼图
def print_pie(group_data,title):
    group_data.plt.pie(title=title,figsize=(6,6),autopct='%.2f%%'\
                      ,startangle=90,legend=True)

# 输出柱状图
def print_bar(data,title):
    bar=data.plot.bar(title=title)
    for p in bar.patches:
        bar.annotate('%.2f%%'%(p.get_height()*100),(p.get_x()*1.005\
                     ,p.get_height()*1.005))
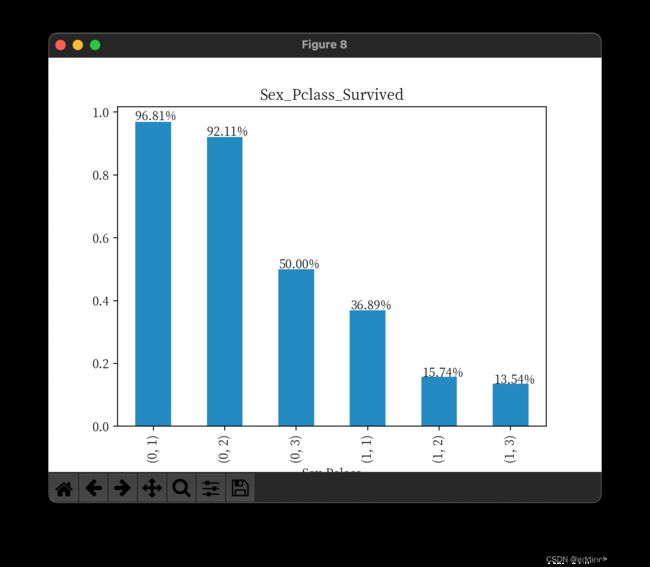
性别和乘客等级共同对生还率的影响
print_bar(group_passenger_survived_rate(titanic_df, ['Sex', 'Pclass']), 'Sex_Pclass_Survived')
结论:
- 对生还率的影响性别>乘客等级,其次是乘客等及对生还率的影响是1>2>3等
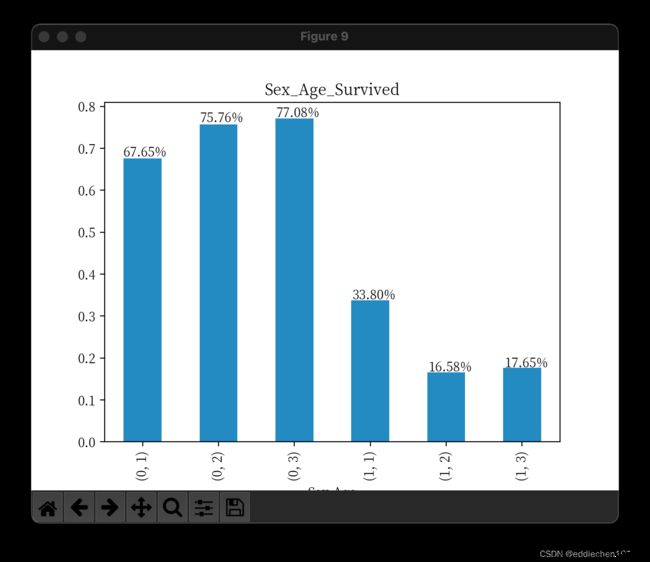
性别和年纪对生还率的影响
# 指定 p_class 分组计算每组的人数
def p_class_survived_all(df, p_class):
    return df.groupby(p_class)['Sex'].count()


# 按 p_class分组计算每组的生还率
def p_class_survived_probability(survived_df, all_df, p_class):
    # 计算每组生还者的人数
    group_by_survived = p_class_survived_all(survived_df, p_class)

    # 计算每组的总人数
    group_by_survived_all = p_class_survived_all(all_df, p_class)
    return group_by_survived / group_by_survived_all


plt.figure()
print_bar(p_class_survived_probability(titanic_df[['Age', 'Sex', 'Pclass']][titanic_df['Survived'] == 1],
                                       titanic_df[['Age', 'Sex', 'Pclass']],
                                       ['Sex', 'Age']),
                                       'Sex_Age_Survived')
结论:
- 可以看出,对生还率影响大的是性别,女性>男性
- 其次少年的生还率大于青年和老年,青年跟老年的对生还率差不多
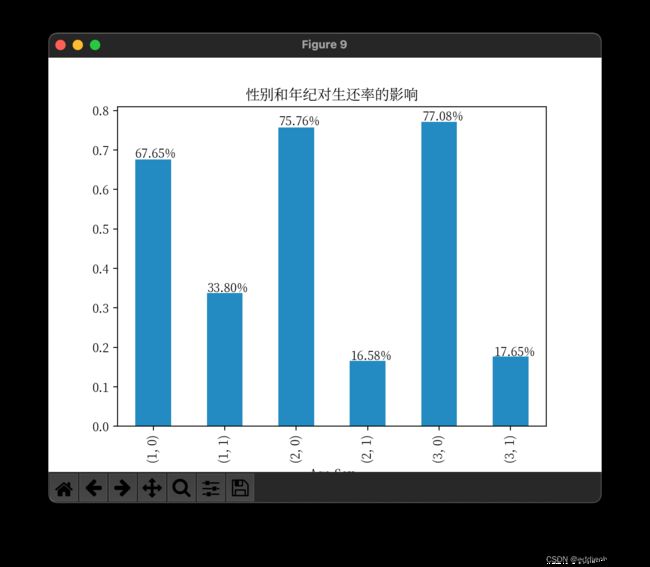
年龄和性别共同对生还率的影响
print_bar(group_passenger_survived_rate(titanic_df, ["Age", "Sex"]), "性别和年纪对生还率的影响")
Age中用1表示少年, 用2表示青年, 用3表示老年
结论:
- 可以看出,对生还率影响大的是性别,女性>男性
- 其次少年的生还率大于青年和老年,青年跟老年的对生还率差不多
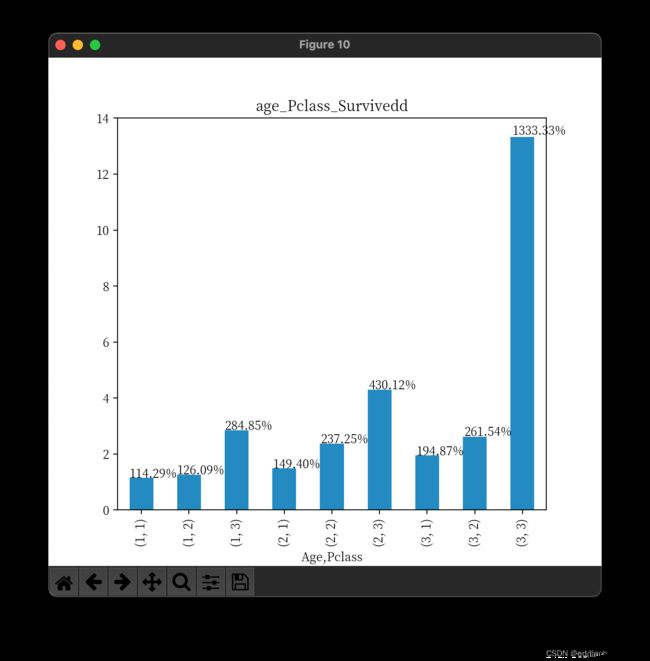
年龄和乘客等级共同对生还率的影响
plt.figure()
print_bar(p_class_survived_probability(
    titanic_df[['Age', 'Sex', 'Pclass']],
    titanic_df[['Age', 'Sex', 'Pclass']][titanic_df['Survived'] == 1],
    ['Age', 'Pclass']), "age_Pclass_Survivedd")
结论:
- 可以看出乘客的等级对生还率的影响>乘客年龄的影响
- 年龄越大生还率越小,乘客等级越差生还率越差
结论
通过分析,可以看出对生还率影响最大的因素是乘客等级,其次是性别,最后年龄段也对生化率有影响
分析的局限性
- 这里并没有从统计上分析得出这些结果的偶然性,所以并不知道这里的结果是真正的差异造成的还是噪音造成的
- 年龄字段有一些缺失值,因为是连续数据这里用的是全体乘客年龄的均值填充缺失值,这样会缩小年龄之间的差异,也会影响分析结果
结果的相关性
- 这里的数据并非通过试验得出,所以无法说自变量之间的因果性,只能说她们之间有相关性
