Python_爬虫系列_10.各种案例集合
Spider-10.案例集合
几个简单的小案例,以供参考(每天都要看-敲)!!
以后还要补的
文章目录
- Spider-10.案例集合
- Python_爬虫系列文章目录
-
- Python_爬虫系列_1.BeautifulSoup
- Python_爬虫系列_2.XPath
- Python_爬虫系列_3.Re(正则表达式)
- Python_爬虫系列_4.Numpy库的学习
- Python_爬虫系列_5.Pandas,Matplotlib,Pyecharts和Echarts
- Python_爬虫系列_10.综合案例
- 前言
- 一、简单爬虫案例
-
- 1.爬取中国工程院院士信息包括头像和简介并存储
- 2、翻译
- 3、豆瓣电影爬取
- 4、模块例子
- 5、上机--爬虫1
- 6、小说爬取
- 二、MongoDb的案例
-
- 1.MongoDB 模板
- 2、去哪儿网(搞了一上午,非常值得学习)
- 3、pymongo的模板
- 三、天气案例并写入数据库
-
- 第一部分
- 第二部分
- 第三部分
- 第四部分
- 第五部分
- 四.Selenium
-
- 1、去哪网的案例
- 2、百度设置调整
- 3、截图(觉得有趣)
- 4、抽屉网的登录点赞
-
- 1.出处---[GitHub上的值得参考](https://github.com/cassieeric/python_crawler/blob/master/)
- 5、QQ邮箱的登陆及皮肤换
-
- 自个写的值得夸!!!
- 6、嘿嘿!!(嘻刷刷)
- 五、python课程设计
-
- 1.北京高考分数线统计分析
- 2.预处理地区信息
- 3.运动员信息的分组与聚合
- 4.可视化分析某年河北省旅游景点数据
- 1.北京租房数据统计分析
- 总结
Python_爬虫系列文章目录
Python_爬虫系列_1.BeautifulSoup
Python_爬虫系列_2.XPath
Python_爬虫系列_3.Re(正则表达式)
Python_爬虫系列_4.Numpy库的学习
Python_爬虫系列_5.Pandas,Matplotlib,Pyecharts和Echarts
Python_爬虫系列_10.综合案例
前言
不积硅步何以致千里。一、简单爬虫案例
1.爬取中国工程院院士信息包括头像和简介并存储
# 爬取中国工程院院士信息包括头像和简介并存储
import re
from urllib.request import urlopen

import  requests
url=r'https://www.cae.cn/cae/html/main/col48/column_48_1.html'
strhtml=requests.get(url)
pattern=r'<li class="name_list"><a href="(.+)" target="_blank">(.+)</a></li>'
furhtml=re.findall(pattern,strhtml.text)
# print(furhtml)
for  item in furhtml:
    perUrl, name = item
    realref=r'https://www.cae.cn/'+perUrl
    delhtml=requests.get(realref)
    # print(delhtml.text)
    pattern1=r'<img src="/cae/admin/upload/img/(.+)" style='
    result=re.findall(pattern1, delhtml.text,re.I)
    # print(result[0])
#https://www.cae.cn/cae/admin/upload/img/20200311095622881157087.jpg
#https://www.cae.cn/cae/admin/upload/img/20160504155634976300642.jpg
    picUrl = r'https://www.cae.cn/cae/admin/upload/img/' + result[0]
    with open(name + '.jpg', 'wb') as pic:
        pic.write(urlopen(picUrl).read())
#-----------------------------------------------

from urllib.request import urlopen

response =urlopen('http://www.baidu.com/')
result=response.read().decode('utf-8')

with open("first.html",'w',encoding='utf-8') as fp:
    fp.write(result)
    fp.close()
2、翻译
import requests
url="https://fanyi.baidu.com/sug"
s=input("请输入要翻译的单词:")
dat={
    "kw":s
}
resp=requests.post(url,data=dat)
print(resp.json())
resp.close()
3、豆瓣电影爬取
import requests
url="https://movie.douban.com/j/chart/top_list?"
para={
    'type': '24',
    'interval_id': '100:90',
    'action': '',
    'start': '20',
    'limit': '20',
}
header={
    "User-Agent": "Mozilla/5.0 (Windows NT 10.0; Win64; x64) AppleWebKit/537.36 (KHTML, like Gecko) Chrome/92.0.4515.107 Safari/537.36 Edg/92.0.902.62"
}
resp=requests.get(url=url,params=para,headers=header)
with open("douban.txt", mode="w", encoding="utf-8") as f:
    f.write(resp.text)
print(resp.json())
f.close()
resp.close()
4、模块例子
import requests


def getHTNLtext(url):
    try:
        r = requests.get(url, timeout=30)
        r.raise_for_status()
        r.encoding = r.apparent_encoding
        return r.text
    except:
        return "获取异常"

if __name__ == '__main__':
    url = "http://www.baidu.com/"
    print(getHTNLtext(url))
5、上机–爬虫1
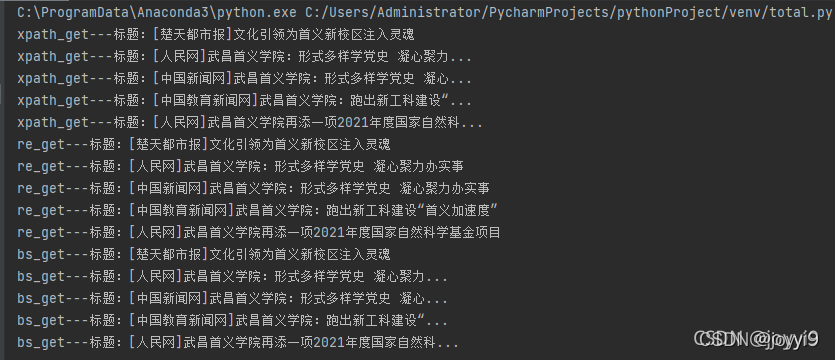
1.编写写一个简单的爬虫程序,爬取武昌首义学院的学校要闻主题,理解爬虫的概念、网页的结构及爬虫工作原理。
import requests
from bs4 import BeautifulSoup # 从bs4库中导入BeautifulSoup
import re
from lxml import etree
def return_html():
url = 'http://www.wsyu.edu.cn/'
strhtml = requests.get(url) # get方式,获取网页数据
strhtml.encoding=strhtml.apparent_encoding
return strhtml
def xpath_get(x):
html=etree.HTML(x.text)
ul=html.xpath("//li/p[@class='title']/a/text()")
for i in ul:
print("xpath_get---标题:"+i)
def re_get(x):
pattern=r'<p class="title"><a href="(.+)" target="_blank" title="(.+)">.+</a></p>'
data = re.findall(pattern, x.text)
for i in data:
print("re_get---标题:"+i[1])
def bs_get(x):
soup = BeautifulSoup(x.text,'lxml')
data = soup.select('#index > div.block.block1 > div > div.spot > div > ul > li> p>a')
for item in data:
print("bs_get---标题:"+item.get_text())
if __name__=='__main__':
x=return_html()
xpath_get(x)
re_get(x)
bs_get(x)

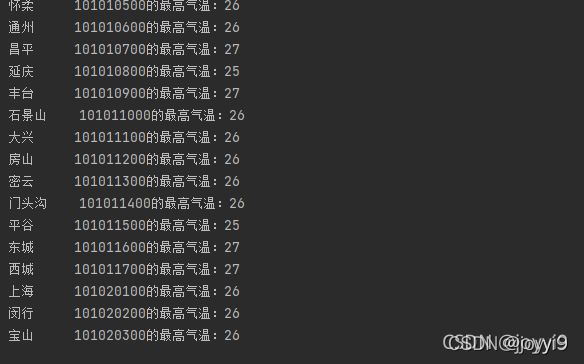
2.掌握API数据的获取方式,MongoDB数据库的安装、配置和数据的查询。
要求:
- 1.安装好Python第三方库bs4,能正确使用Beautiful Soup库,中的select方法;
- 2.学会使用页面审查元素的辅助工具,查看某元素的选择器。
- 3.注册免费API并会阅读技术文档,熟悉API的运作方式。
import requests
import  json
import time
url='http://cdn.heweather.com/china-city-list.txt'
strhtml=requests.get(url)
strhtml.encoding=strhtml.apparent_encoding
data=strhtml.text
data1 = data.split("\n")
for i in range(6):
    data1.remove(data1[0])

for item in data1[:20]:
    url = 'https://devapi.heweather.net/v7/weather/3d?location=' + item[4:13] + '&key=6d16870a745349578f01e664d3482521'
    strhtm=requests.get(url)
    time.sleep(1)
    dic = strhtm.json()
    print(item[38:45]+item[4:13]+"的最高气温:"+dic["daily"][0]["tempMax"])
6、小说爬取
import requests
import json
import csv
from lxml import etree
# 预期的数据在网页中的字段
# 调用requests库生成会话
ss = requests.session()
# 为会话添加UA,初步过反爬虫
ss.headers = {'user-agent': 'Mozilla/5.0 (Windows NT 10.0; Win64; x64) AppleWebKit/537.36 (KHTML, like Gecko) Chrome/92.0.4515.159 Safari/537.36'}
# 请求目标网页
respond = ss.get(url='https://top.baidu.com/board?tab=novel')
# 解析目标网页
# items = bs4.BeautifulSoup(respond.text, 'lxml').select('.list-item')
# # # 预先准备储存结果的list
html=etree.HTML(respond.text)
title=html.xpath("//*[@id='sanRoot']/main/div[2]/div/div[2]/div/div[2]/a/div/text()")
auther=html.xpath("//*[@id='sanRoot']/main/div[2]/div/div[2]/div/div[2]/div[1]/text()")
type=html.xpath("//*[@id='sanRoot']/main/div[2]/div/div[2]/div/div[2]/div[2]/text()")
description=html.xpath("//*[@id='sanRoot']/main/div[2]/div/div[2]/div/div[2]/div[3]/text()")
description=html.xpath("//*[@id='sanRoot']/main/div[2]/div/div[2]/div/div[2]/div[3]/text()")
hotindex=html.xpath("//*[@id='sanRoot']/main/div[2]/div/div[2]/div/div[1]/div[2]/text()")
x=html.xpath("//*[@id='sanRoot']/main/div[2]/div/div[2]")
result = []
for i in x:
    title=i.xpath("./div/div[2]/a/div/text()")
    auther=i.xpath("./div/div[2]/div[1]/text()")
    type=i.xpath("./div/div[2]/div[2]/text()")
    description=i.xpath("./div/div[2]/div[3]/text()")
    hotindex=i.xpath("./div/div[1]/div[2]/text()")
    result.append(title)
    result.append(auther)
    result.append(type)
    result.append(description)
    result.append(hotindex)
print(result)
二、MongoDb的案例
1.MongoDB 模板
# '''先导入模块,没有的话就去 File > Settings 下载 或者 pip3 instll pymongo'''
import pymongo
# 连接到 MongoDB 数据库
mongoClient = pymongo.MongoClient(host=" 192.168.1.229", port=27017)

# 操作一个库,格式:mongoClient.库名  如果该库存在表示使用该库,如果该库不存在表示创建该库
db = mongoClient.DatabaseName

# 操作一个集合
collection = db.CollectionName

# 查询过滤后的数据
'''需要注意,python中只能使用列表进行排序,不能使用字典,所以sort后面不能使用{}需要换成[]'''
results = collection.find({"field3": "西宁"})

# 循环遍历并打印结果
for result in results:
    print(result)

# 操作结束后一定要记得关闭连接
mongoClient.close()
2、去哪儿网(搞了一上午,非常值得学习)
import time
import urllib.request

import requests
import pymongo
client = pymongo.MongoClient('localhost',27017) # 在MongoDB中创建数据库
book_qunar = client['qunar'] # 在数据库中创建表sheet_qunar_zyx
sheet_qunar_zyx = book_qunar['qunar_zyx']

# 获取出发地站点信息
url = 'https://touch.dujia.qunar.com/depCities.qunar'
strhtml = requests.get(url)
# print(strhtml.text)
dep_dict = strhtml.json()
# print(dep_dict)
for dep_item in dep_dict['data']:
    for dep in dep_dict['data'][dep_item]:
        a = []
        # print('departion', dep)
        url = 'https://touch.dujia.qunar.com/golfz/domestic/domesticDest?dep={0}&exclude=&extensionImg=255,175'.format(
            dep)

        time.sleep(1)
        strhtml = requests.get(url)
        arrive_dict = strhtml.json()
        for arr_item in arrive_dict['data']:
            for arr_item_1 in arrive_dict['data'][arr_item]:
                # print(arr_item_1)
                for arr_item_2 in arr_item_1['subModules']:
                    for query in arr_item_2['items']:
                        # print(query['query'])
                        if query['query'] not in a:
                            a.append(query['query'])
        # print("arrive:", a)
        for item in a:
            # print(item)
            urlx = 'https://touch.dujia.qunar.com/list?modules=list%2CbookingInfo%2CactivityDetail&dep={0}&' \
                   'query={1}&dappDealTrace=true&mobFunction=%E6%89%A9%E5%B1%95%E8%' \
                   '87%AA%E7%94%B1%E8%A1%8C&cfrom=zyx&it=dujia_hy_destination&date=&needNoResult=true&originalquery={2}&width=480&height=320&quality=90&limit=0,28&includeAD=true&qsact=' \
                   'search'.format(dep, item, item)
            header = {
                'User-Agent': ' Mozilla/5.0 (Linux; Android 6.0; Nexus 5 Build/MRA58N) AppleWebKit/537.36 (KHTML, like Gecko) Chrome/94.0.4606.61 Mobile Safari/537.36'
            }

            strhtml = requests.get(urlx)
            # print(strhtml.text)

            try:
                routeCount = int(strhtml.json()['data']['limit']['routeCount'])
                print(routeCount)
            except:
                continue  # 没有这条路径说明对应的出发地到目的地没有产品,直接跳过看下一个目的地
            for limit in range(0,routeCount,20):
                # print(item)
                urlx = 'https://touch.dujia.qunar.com/list?modules=list%2CbookingInfo%2CactivityDetail&dep={0}&' \
                       'query={1}&dappDealTrace=true&mobFunction=%E6%89%A9%E5%B1%95%E8%' \
                       '87%AA%E7%94%B1%E8%A1%8C&cfrom=zyx&it=dujia_hy_destination&date=&needNoResult=true&originalquery={2}&width=480&height=320&quality=90&limit={3},28&includeAD=true&qsact=' \
                       'search'.format(dep, item, item,limit)
                header = {
                    'User-Agent': ' Mozilla/5.0 (Linux; Android 6.0; Nexus 5 Build/MRA58N) AppleWebKit/537.36 (KHTML, like Gecko) Chrome/94.0.4606.61 Mobile Safari/537.36'
                }

                strhtml = requests.get(urlx)
                # print(strhtml.text)

            result = {
                'date': time.strftime('%Y-%m-%d', time.localtime(time.time())),
                'dep': dep,
                'arrive': item,
                'limit': limit,
                'result': strhtml.json()}
            sheet_qunar_zyx.insert_one(result)
3、pymongo的模板
import pymongo
#使用指定主机和端口的方法创建客户端实例
client=pymongo.MongoClient('localhost',27017)
book_weather=client['Try1']#数据库的实例
sheet_weather=book_weather['name']#集合的实例
#插入
sheet_weather.insert_one(dic['now'])#插入
#也可以使用 insert_many() 方法。通过给他的第一个参数传入一个**列表**
#查看
#默认是第一条
sheet_weather.find_one()
#可以加上筛选--不忘json
sheet_weather.find_one({'temp': '24'})
# print(sheet_weather.find())
# 三、天气案例并写入数据库
第一部分
import  requests
import time
url='http://cdn.heweather.com/china-city-list.txt'
strhtml=requests.get(url)
strhtml.encoding = 'utf8'
data=strhtml.text
print(data)

data1=data.split("\n")

for i in range(6):
    data1.remove(data1[0])
print(data1)

for item in data1:
    print(item[2:13])
    #url='d'
    url='https://devapi.heweather.net/v7/weather/7d?location='+item[2:13]+'&key=509ff55cddc6407592f28f3fa3c80bf6'
    strhtml=requests.get(url)
    time.sleep(1)
    print(strhtml.text)
    dic = strhtml.json()
    # for item in dic["HeWeather6"][0]['daily_forecast']:
    #     print(item['tmp_max'])
    for item in dic['daily']:
        print(item['tempMax'])
第二部分
import requests
import time
import pymongo
client = pymongo.MongoClient('localhost', 27017)
book_weather = client['Try1']
sheet_weather = book_weather['name']
with open("china-city-list.txt", "r+", encoding="UTF-8")as f:
data = f.read()
data1 = data.split("\n")
for i in range(6):
data1.remove(data1[0])
# url='http://cdn.heweather.com/china-city-list.txt'
# strhtml=requests.get(url)
# strhtml.encoding = 'utf8'
# data=strhtml.text
# print(data)
# data1=data.split("\n")
# for i in range(6):
# data1.remove(data1[0])
for item in data1[:2]: # 为便于测试,仅取20行数据
# url='https://free-api.heweather.net/s6/weather/forecast?location='+item[4:13]+'&key=6d16870a745349578f01e664d3482521'
url = 'https://devapi.heweather.net/v7/weather/now?location=' + item[4:13] + '&key=6d16870a745349578f01e664d3482521'
strhtml = requests.get(url)
time.sleep(1)
dic = strhtml.json()
# print(['windDir'])
# for item in dic["HeWeather6"][0]['daily_forecast']:
# print(item['tmp_max'])
# sheet_weather.insert_one(dic['now'])
# print(sheet_weather.find_one({'temp': '24'}))
# print({'_id':'6140720d59dc0def2d252e34'})
# print(sheet_weather.find())
# 第三部分
import pymongo
client=pymongo.MongoClient('localhost',27017)
book_weather=client['weather']
sheet_weather=book_weather['sheet_weather_3']
# 查找键HeWeather6.basic.location值为北京的数据
for item in sheet_weather.find({'HeWeather6.basic.location':'北京'}):
    print(item)
#for item in sheet_weather.find({'daily.location':'北京'}):
#    print(item)
第四部分
import pymongo
client=pymongo.MongoClient('localhost',27017)
book_weather=client['weather']
sheet_weather=book_weather['sheet_weather_3']
for item in sheet_weather.find():
    # 因为数据需要3天的天气预报,因此循环3次
    for i in range(3):
        try: # 需要增加异常处理,有些表中的item项内容为空
            # 取出最低温的字符串
            tmp=item["HeWeather6"][0]['daily_forecast'][i]['tmp_min']
            # 使用update方法,将表中最低气温数据修改为数值型
            sheet_weather.update_one({'_id':item['_id']},{'$set':{'HeWeather6.0.daily_forecast.{}.tmp_min'.format(i):int(tmp)}})
        except:
            continue
    # 提取出最低气温低于5摄氏度的城市
    for item in sheet_weather.find({'HeWeather6.daily_forecast.tmp_min':{'$gt':5}}):
        print(item['HeWeather6'][0]['basic']['location'])
第五部分
import pymongo
client=pymongo.MongoClient('localhost',27017)
book_weather=client['weather']
sheet_weather=book_weather['sheet_weather_3']
# 查找键HeWeather6.basic.location值为北京的数据
for item in sheet_weather.find({'HeWeather6.basic.location':'北京'}):
    print(item)
#for item in sheet_weather.find({'daily.location':'北京'}):
#    print(item)
四.Selenium
- 浏览器驱动chromedriver下载地址
- 在Windows中,右键此电脑-属性-高级系统设置-环境变量系统环境变量-Path-(将chromedriver.exe任意路径下)
1、去哪网的案例
import requests
import urllib.request
import time
import random
from selenium import webdriver
from selenium.webdriver.common.by import By  # 用于指定HTML文件中的DOM元素
from selenium.webdriver.support.ui import WebDriverWait  # 用于等待网页加载完成
from selenium.webdriver.support import expected_conditions as EC  # 用于指定标志网页加载结束的条件

'''
去哪网PC端自由行 https://fh.dujia.qunar.com/?tf=package
ChromeDriver下载 https://npm.taobao.org/mirrors/chromedriver
'''


# 每次发送请求隔一会(模拟用户的输入和检查较慢)
def get_url(url):
    time.sleep(1)
    return (requests.get(url))


if __name__ == "__main__":
    # 用驱动打开Chrome浏览器
    driver = webdriver.Chrome()  # 初始化一个Chrome浏览器对象
    # dcap = dict(DesiredCapabilities.PHANTOMJS)
    # dcap["phantomjs.page.settings.loadImages"] = False
    # driver = webdriver.PhantomJS( desired_capabilities=dcap)
    # 出发地城市列表
    dep_cities = ["北京", "上海", "广州", "深圳", "天津", "杭州", "南京", "济南", "重庆", "青岛",
                  "大连", "宁波", "厦门", "成都", "武汉", "哈尔滨", "沈阳", "西安", "长春", "长沙", "福州",
                  "郑州", "石家庄", "苏州", "佛山", "烟台", "合肥", "昆明", "唐山", "乌鲁木齐", "兰州",
                  "呼和浩特", "南通", "潍坊", "绍兴", "邯郸", "东营", "嘉兴", "泰 州", "江阴", "金华", "鞍山",
                  "襄阳", "南阳", "岳阳", "漳州", "淮安", "湛江", "柳州", "绵阳"]
    # 对每个出发地
    for dep in dep_cities:
        # 去哪儿网点击目的地搜索时的RequestURL
        strhtml = get_url('https://touch.dujia.qunar.com/golfz/sight/arriveRecommend?dep=' +
                          urllib.request.quote(dep) + '&extensionImg=255,175')
    # 查询到的就是该出发地选定后供选择的若干目的地
    arrive_dict = strhtml.json()
    # 这里得到的是列表中的一项项dict
    for arr_item in arrive_dict['data']:
        # 该dict里面subModules列表里的每一项
        for arr_item_1 in arr_item['subModules']:
            # 该项的item字段所示列表的每一项
            for query in arr_item_1['items']:
                # 通过浏览器打开网页
                driver.get("https://fh.dujia.qunar.com/?tf=package")
                # WebDriverWait(driver, 10)意思是使driver保持等待,最多10秒
                # .until()里指定等待的是什么事件
                # EC.presence_of_element_located()里面指定标志等待结束的DOM元素
                # 里面传入元组(By.ID, "depCity")意思是等待id="depCity"的元素加载完成
                WebDriverWait(driver, 10).until(EC.presence_of_element_located((By.ID,
                                                                                "depCity")))
                # 在Chrome检查元素后,直接右键Copy XPath即可选择相应的元素!
                # 清空出发地文本框
                driver.find_element_by_xpath("//*[@id='depCity']").clear()
                # 将出发地写进去
                driver.find_element_by_xpath("//*[@id='depCity']").send_keys(dep)
                # 将目的地写进去
                driver.find_element_by_xpath("//*[@id='arrCity']").send_keys(query[" query "])
                # 点击[开始定制]按钮
                # // *[ @ id = "app"] / div / main

                driver.find_element_by_xpath("/html/body/div[2]/div[1]/div[2]/div[3]/ div / div[2] / div / a ").click()
                print("dep:%s arr:%s" % (dep, query["query"]))
                # 最多抓2页,每页有10项产品列表,故每条线路抓取2页,即20项产品列表
                for i in range(2):
                    # 随机等待5~6秒,模拟用户每页看个五六秒
                    time.sleep(random.uniform(5, 6))
                    # 关于[下一页]按钮:在不同的页上,下一页按钮的XPath是不一样的,比如下面两个
                    # // *[ @ id = "pager"] / div / a[7]
                    # // *[ @ id = "pager"] / div / a[8]
                    # 因此不能通过这种方式来实现点击下一页
                    # 可以用XPath获得翻页的整块元素,提取每个'下一页'按钮公共部分的XPath
                    pageBtns = driver.find_elements_by_xpath(
                        "html/body/div[2]/div[2]/div[7]")
                    # 如果获取不到页码按钮,说明从出发地到目的地没有产品,直接跳出
                    if pageBtns == []:
                        break
                # 旅行方案所有产品的列表
                # 提取每个旅行方案列表公共部分的XPath
                routes = driver.find_elements_by_xpath('//*[@id="list"]/div')
                for route in routes:
                    result = {
                        'date': time.strftime('%Y-%m-%d',
                                              time.localtime(time.time())),
                        'dep': dep,
                        'arrive': query['query'],
                        'result': route.text
                    }
                print(result)
                if i < 9:
                    # 找到翻页按钮,并点击翻页
                    btns = driver.find_elements_by_xpath(
                        "/html/body/div[2]/div[2]/div[7]")
                    for a in btns:
                        if a.text == u"下一页":
                            a.click()
                            break

driver.close()
2、百度设置调整
import time

from selenium import webdriver
#1.引入 ActionChains 类
from selenium.webdriver.common.action_chains import ActionChains

#1.创建Chrome浏览器对象,这会在电脑上在打开一个浏览器窗口
driver = webdriver.Chrome()

driver.get("https://www.baidu.com")
driver.refresh()
driver.set_window_size(1400, 600)

#2.定位到要悬停的元素
element= driver.find_element_by_id("s-usersetting-top")

#3.对定位到的元素执行鼠标悬停操作
ActionChains(driver).move_to_element(element).perform()

#找到链接
elem1=driver.find_element_by_link_text("搜索设置")
elem1.click()

#通过元素选择器找到id=sh_2,并点击设置
# elem2=driver.find_element_by_id("sh_1")
# elem2.click()
time.sleep(2)

#保存设置
elem3=driver.find_element_by_link_text("保存设置")
elem3.click()

driver.switch_to.alert.accept()
3、截图(觉得有趣)
from selenium import webdriver
from time import sleep

driver =webdriver.Chrome()
driver.get('http://www.baidu.com')

driver.find_element_by_id('kw').send_keys('selenium')
driver.find_element_by_id('su').click()
sleep(2)

#1.截取当前窗口,并指定截图图片的保存位置
driver.get_screenshot_as_file("D:\\baidu_img.png")

driver.quit()
4、抽屉网的登录点赞
1.出处—GitHub上的值得参考
import time
from selenium import webdriver
from selenium.webdriver.support.wait import WebDriverWait
from lxml import etree
import requests
# 抽屉账号密码
PHONE = "18872623922"
PWD = "z123456789"
# 抽屉url
url = 'https://dig.chouti.com/'

# 初始化
def init():
    # 定义为全局变量,方便其他模块使用
    global browser, wait
    # 实例化一个chrome浏览器
    browser = webdriver.Chrome()
    # 最大化窗口
    browser.maximize_window()
    time.sleep(2)
    # 设置等待超时
    wait = WebDriverWait(browser, 20)

# 登录
def login():
    # 打开登录页面
    browser.get(url)
    # # 获取用户名输入框
    browser.find_element_by_id("login_btn").click()

    # 输入账号密码
    browser.find_element_by_name("phone").send_keys(PHONE)
    browser.find_element_by_name("password").send_keys(PWD)

    # 点击登录
    time.sleep(2)
    click_login_btn_js = 'document.getElementsByClassName("btn-large")[0].click()'
    browser.execute_script(click_login_btn_js)
    time.sleep(15)

    # 获取cookie
    get_cookies_js = "return document.cookie"
    cookie = browser.execute_script(get_cookies_js)
    print(cookie)

    with open("cookie.txt", "w", encoding="utf-8") as f:
        f.write(cookie)
    # page_source = browser.page_source
    # with open("page.html","w",encoding="utf-8") as f:
    #     f.write(page_source)

def readinfo():
    with open("cookie.txt", "r", encoding="utf-8") as f:
        cookie = f.read()

    base_url = "https://dig.chouti.com/"
    header_dict = {
        "Accept": "text/html,application/xhtml+xml,application/xml;q=0.9,image/webp,image/apng,*/*;q=0.8,application/signed-exchange;v=b3",
        "Accept-Encoding": "gzip, deflate, br",
        "Accept-Language": "zh-CN,zh;q=0.9",
        "Cache-Control": "max-age=0",
        "Connection": "keep-alive",
        "Host": "dig.chouti.com",
        "Referer": "https://dig.chouti.com/?showLogin=true",
        "Sec-Fetch-Mode": "navigate",
        "Sec-Fetch-Site": "same-origin",
        "Sec-Fetch-User": "?1",
        "Upgrade-Insecure-Requests": "1",
        "User-Agent": "Mozilla/5.0 (Windows NT 10.0; Win64; x64) AppleWebKit/537.36 (KHTML, like Gecko) Chrome/78.0.3904.70 Safari/537.36"
    }
    r1 = requests.get(url=base_url, headers=header_dict)
    r1.encoding = r1.apparent_encoding

    html = etree.HTML(r1.content)

    # 文章id列表
    data_id_list = html.xpath("//a[@class='link-title link-statistics']/@data-id")
    print(data_id_list)

    lick_url = "https://dig.chouti.com/link/vote"
    header_dict = {
        "Accept": "application/json, text/javascript, */*; q=0.01",
        "Accept-Encoding": "gzip, deflate, br",
        "Accept-Language": "zh-CN,zh;q=0.9",
        "Connection": "keep-alive",
        "Content-Length": "15",
        "Content-Type": "application/x-www-form-urlencoded; charset=UTF-8",
        "Cookie": f"{cookie}",
        "Host": "dig.chouti.com",
        "Origin": "https://dig.chouti.com",
        "Referer": "https://dig.chouti.com/",
        "Sec-Fetch-Mode": "cors",
        "Sec-Fetch-Site": "same-origin",
        "User-Agent": "Mozilla/5.0 (Windows NT 10.0; Win64; x64) AppleWebKit/537.36 (KHTML, like Gecko) Chrome/78.0.3904.70 Safari/537.36",
        "X-Requested-With": "XMLHttpRequest"
    }

    # 点赞
    for data_id in data_id_list[:2]:
        print(data_id)
        r1 = requests.post(url=lick_url, headers=header_dict, data={"linkId": data_id})
        print(r1.text)
        time.sleep(1)

    # 自动点赞


if __name__ == '__main__':
    init()
    login()
    readinfo()
# 自动登录抽屉
5、QQ邮箱的登陆及皮肤换
自个写的值得夸!!!
from selenium import webdriver
import time
import requests
from lxml import etree

driver = webdriver.Chrome()


def log_onqq_emainl(u, p):
    driver.get("https://mail.qq.com/")
    driver.switch_to.frame("login_frame")
    driver.find_element_by_id("login_button").click()
    time.sleep(1)
    driver.find_element_by_id("u").send_keys(u)
    time.sleep(1)
    driver.find_element_by_id("p").send_keys(p)
    time.sleep(1)
    driver.find_element_by_id("login_button").click()
    time.sleep(1)
    # driver.find_element_by_id("")


def change_Skin():
    driver.get('https://mail.qq.com/cgi-bin/frame_html?sid=BjflCTPH-xhKxVk4&r=e22b51fd2e7601ad7481bbf514e05019')
    driver.find_element_by_id('changeSkin').click()
    driver.switch_to.frame("mainFrame")
    for i in driver.find_elements_by_xpath('/html/body/div[4]/div[3]/fieldset[2]/div/table/tbody/tr[1]/td/img'):
        i.click()
        time.sleep(3)

    driver.find_element_by_class_name('face4').click()
    time.sleep(3)
    driver.find_element_by_class_name('face22').click()
    time.sleep(3)
    driver.switch_to.default_content()
    driver.find_element_by_id('folder_1').click()
    time.sleep(3)
    driver.switch_to.frame("mainFrame")
    driver.find_element_by_id('ckb_selectAll').click()
    time.sleep(3)
    driver.find_element_by_id('quick_del').click()


if __name__ == '__main__':
    log_onqq_emainl('2632399409', 'zzy147258369')
    change_Skin()
6、嘿嘿!!(嘻刷刷)
import time

from selenium import webdriver
# 1.引入 ActionChains 类
from selenium.webdriver.common.action_chains import ActionChains

# 1.创建Chrome浏览器对象,这会在电脑上在打开一个浏览器窗口
driver = webdriver.Chrome()

driver.get("https://blog.csdn.net/joyyi9?type=blog")
driver.refresh()
driver.set_window_size(1400, 600)
print(driver.window_handles)
time.sleep(2)
for j in range(3):
    for i in range(1,21):
        # elem1=driver.find_element_by_xpath('//*[@id="userSkin"]/div[2]/div/div[2]/div/div[2]/div/article[21]/a')
        elem1 = driver.find_element_by_xpath(
            '//*[@id="userSkin"]/div[2]/div/div[2]/div/div[2]/div/article[' + str(i) + ']/a')
        elem1.click()
        time.sleep(1)
        handle = driver.current_window_handle
        # 获取当前所有窗口句柄(窗口A、B)
        handles = driver.window_handles
        # 对窗口进行遍历
        for newhandle in handles:
        # 筛选新打开的窗口B
            if newhandle != handle:
            # 切换到新打开的窗口B
                driver.switch_to_window(newhandle)
                # 在新打开的窗口B中操作
                # driver.find_element_by_id('xx').click()
                # 关闭当前窗口B
                driver.close()
                # 切换回窗口A
                driver.switch_to_window(handles[0])
    time.sleep(10)
五、python课程设计
1.北京高考分数线统计分析
主要内容:
为了帮助广大考生和家长了解高考历年的录取情况,很多网站都汇总了各省市的录取控制分数线,为广大考生填报志愿提供参考。因受多种因素影响,每年的分数线或多或少会有一些变动。从网站上如(http://gaokao.xdf.cn/)上采集北京2006-2019年的信息。要求使用Python的Pandas库完成以下数据分析的任务:
① 一本文理科与二本文理科最高的分数线是多少,最低的分数线是多少,相差多少分。
② 今年与去年相比,一本文理科与二本文理科变化了多少分。
③求2006—2019年近14年每科分数线的平均值。
# 获取网上的数据
import requests
import pandas as pd
import matplotlib as mpl
import matplotlib.pyplot as plt
html = requests.get('http://gaokao.xdf.cn/201805/10784251.html')  # 要爬取的网址
table_data = pd.read_html(html.content, encoding='utf-8')  # 读取网页上的详细
data = table_data[0][4:17][[0,1, 2, 3, 4]].reset_index(drop=True)  # 提取4,17行,1234列,删除原有的index

data.columns = ['年份',"一本文科", "一本理科", "二本文科", "二本理科"]
# data.index = index_list
print(data)
data.to_csv(r'scores.csv')  # 写入csv件

df = pd.read_csv("scores.csv")
# print(df)

col=df[["年份",'一本理科','一本文科','二本理科','二本文科']]
cols=col.set_index('年份')#设置索引
print(cols)
print("一本理科的最高分数线:"+str(cols['一本理科'].max()))
print("一本理科的最低分数线:"+str(cols['一本理科'].min()))
print("一本理科的最低与最高相差分数:"+str(cols['一本理科'].max()-cols['一本理科'].min()))
print("--"*10)
print("一本文科的最高分数线:"+str(cols['一本文科'].max()))
print("一本文科的最低分数线:"+str(cols['一本文科'].min()))
print("一本文科的最低与最高相差分数:"+str(cols['一本文科'].max()-cols['一本理科'].min()))
print("--"*10)
print("二本理科的最高分数线:"+str(cols['二本理科'].max()))
print("二本理科的最低分数线:"+str(cols['二本理科'].min()))
print("二本理科的最低与最高相差分数:"+str(cols['二本理科'].max()-cols['二本理科'].min()))
print("--"*10)
print("二本文科的最高分数线:"+str(cols['二本文科'].max()))
print("二本文科的最低分数线:"+str(cols['二本文科'].min()))
print("二本文科的最低与最高相差分数:"+str(cols['二本文科'].max()-cols['二本文科'].min()))
print("+++"*10)
#第二种方法
# df1= df.groupby(['一本理科','一本文科'], as_index=False).min()
# print(df1.min()['一本理科'])
# print(df1.max()['一本理科'])


print("一本理科的平均分数线:"+str(cols['一本理科'].mean()))
print("一本文科的平均分数线:"+str(cols['一本文科'].mean()))
print("二本理科的平均分数线:"+str(cols['二本理科'].mean()))
print("二本文科的平均分数线:"+str(cols['二本文科'].mean()))


# 指定一个2*2布局的正方形画布
# 方法二:如果是在jupyter notebook里,设置下面两行才能显示中文
plt.rcParams['font.family'] = ['sans-serif']
# 如果是在 PyCharm 里,只要下面一行,上面的一行可以删除
plt.rcParams['font.sans-serif'] = ['SimHei']
fig, axes = plt.subplots(2,2,figsize=(10,10))
s1= cols.一本理科
s2=cols.一本文科
s3=cols.二本理科
s4=cols.二本文科
s1.plot(ax = axes[0][0],kind='bar',title="一本理科")
axes[0][0].set_xlabel("年份")
axes[0][0].set_ylabel("分数")
s2.plot(ax = axes[0][1],kind='bar',title="一本文科")
axes[0][1].set_xlabel("年份")
axes[0][1].set_ylabel("分数")
s3.plot(ax = axes[1][0],kind='bar',title="二本理科")
axes[1][0].set_xlabel("年份")
axes[1][0].set_ylabel("分数")
s4.plot(ax = axes[1][1],kind='bar',title="二本文科")
axes[1][1].set_xlabel("年份")
axes[1][1].set_ylabel("分数")
fig.tight_layout()
plt.show()
2.预处理地区信息
主要内容:通过网络爬虫爬取2016年北京地区和天津地区的一些统计信息,并根据不同地区整理成两个文件,分别为“北京地区信息.csv”和“天津地区信息.csv”,利用Pandas对爬取的数据进行预处理,具体任务为:
①检查重复数据,一旦发现有重复的数据,就需要将其进行删除。
②检查缺失值,为保证数据的完整性,通常会使用某个数据来填充。
③检查异常值,一旦发现数据中存在异常值,通常先要对照原始数据进一步确认,如果是错误的数据值,则直接使用正确的数值进行替换。
import pandas as pd
df = pd.read_csv("北京地区信息.csv")
# print(df)
#
# # ①检查重复数据,一旦发现有重复的数据,就需要将其进行删除。
# print(df.duplicated())#进行去重检查
# print(df.drop_duplicates())#删除重复
# print("--" * 10)
# ②检查缺失值,为保证数据的完整性,通常会使用某个数据来填充。
print(df.isnull())
# df1=df.fillna(method='pad')#用前一个数据代替NaN
# df1=df.fillna(method='bfill')#用后一个数据代替NaN,limit=1-->限制每列只能替代一个
# df1=df.fillna('missing')#用字符串代替NaN
df1 = df.fillna(df['常住人口_万人'].mean())  # 用一列的平均值或其他都可代替NaN
print(df1)
print("++_+_+_+_+_" * 7)
#③检查异常值,一旦发现数据中存在异常值,通常先要对照原始数据进一步确认,如果是错误的数据值,则直接使用正确的数值进行替换。
print(df1.describe())#描述信息
df1['行政面积_K㎡_isOutliner']=df1['行政面积_K㎡']>df1['行政面积_K㎡'].quantile(0.75)
df1['户籍人口_万人_isOutliner']=df1['户籍人口_万人']>df1['户籍人口_万人'].quantile(0.75)
df1['男性_isOutliner']=df1['男性']>df1['男性'].quantile(0.75)
df1['女性_isOutliner']=df1['女性']>df1['女性'].quantile(0.75)
df1['GDP_亿元_isOutliner']=df1['GDP_亿元']>df1['GDP_亿元'].quantile(0.75)
df1['常住人口_万人_isOutliner']=df1['常住人口_万人']>df1['常住人口_万人'].quantile(0.75)
print(df1)
#
3.运动员信息的分组与聚合
主要内容:利用爬虫技术从网站上爬取我国部分运动员信息,并整理一份运动员基本信息的统计表格,利用pandas中分组与聚合方法,将统计运动员基本信息进行归类,筛选出所有篮球运动员的基本信息,统计篮球运动员的如下几个指标:
① 统计男篮、女篮运动员的平均年龄、身高、体重。
② 统计男篮运动员年龄、身高、体重的极差值。
③ 统计男篮运动员的体质指数。
# 数据准备
import pandas as pd
import matplotlib as mpl
import matplotlib.pyplot as plt

df = pd.read_csv("运动员信息表.csv")
# print(df)
# # ①	统计男篮、女篮运动员的平均年龄、身高、体重。
# df1 = df[['年龄', '身高', '体重']].groupby(df['性别']).mean()
# print(df1)
# ②	统计男篮运动员年龄、身高、体重的极差值。
df2 = df[df['性别'] == '男'][['年龄', '身高', '体重']]
print(df2)
print("男篮运动员年龄的极差:" + str(df2['年龄'].max() - df2['年龄'].min()))
print("男篮运动员身高的极差:" + str(df2['身高'].max() - df2['身高'].min()))
print("男篮运动员体重的极差:" + str(df2['体重'].max() - df2['体重'].min()))

# 统计男篮运动员的体质指数。
# 指定一个2*2布局的正方形画布
# 方法二:如果是在jupyter notebook里,设置下面两行才能显示中文
plt.rcParams['font.family'] = ['sans-serif']
# 如果是在 PyCharm 里,只要下面一行,上面的一行可以删除
plt.rcParams['font.sans-serif'] = ['SimHei']
fig, axes = plt.subplots(2, 2, figsize=(10, 10))
s1 = df2.年龄
s2 = df2.身高
s3 = df2.体重
s1.plot(ax=axes[0][0], kind='line', title="年龄")
axes[0][0].set_ylabel("单位(年)")
s2.plot(ax=axes[0][1], kind='line', title="身高")
axes[0][1].set_ylabel("单位(cm)")
s3.plot(ax=axes[1][0], kind='line', title="体重")
axes[1][0].set_ylabel("单位(kg)")
fig.tight_layout()
plt.show()
4.可视化分析某年河北省旅游景点数据
主要内容:对于奔波于都市的人群而言,旅游是个非常不错的休闲方式,随着“互联网+”时代的到来,在线旅游更是推动了旅游行业的发展,国内的景点都开启了旅游的热潮。从网上爬取某年河北省景点的相关信息,存储到csv文件中,通过Matplotlib库对采集到的数据绘制图表辅助分析,完成以下指标:
① 用条形图显示河北省景点面积和旅客量位居前三的景点
②用饼状图显示河北省旅客量的占比哪个最多,哪个最少。
# 数据准备
import pandas as pd
import matplotlib as mpl
import matplotlib.pyplot as plt

df = pd.read_csv("风景名胜区.csv")
print(df)
df = df.set_index('名称')
df1 = df[df['省份'] == '河北'][['总面积_平方公里', '游客量_万人次']]
print(df1)

# https://blog.csdn.net/p1306252/article/details/121119290?ops_request_misc=&request_id=&biz_id=102&utm_term=pandas%E5%89%8D%E4%B8%89%E6%9C%80%E5%A4%A7&utm_medium=distribute.pc_search_result.none-task-blog-2~all~sobaiduweb~default-0-121119290.pc_search_insert_es_download_v2&spm=1018.2226.3001.4187
# 以城市和销售额为基准进行降序排序
df2 = df1[["总面积_平方公里"]].sort_values(by=["总面积_平方公里"], ascending=[False]).head(3)
print(df2)
df3 = df1[["游客量_万人次"]].sort_values(by=["游客量_万人次"], ascending=[False])
df4 = df3.head(3)
print(df3)

# 指定一个2*2布局的正方形画布
# 方法二:如果是在jupyter notebook里,设置下面两行才能显示中文
plt.rcParams['font.family'] = ['sans-serif']
# 如果是在 PyCharm 里,只要下面一行,上面的一行可以删除
plt.rcParams['font.sans-serif'] = ['SimHei']
fig, axes = plt.subplots(1, 2, figsize=(10, 5))
s1 = df2.总面积_平方公里
s2 = df4.游客量_万人次
s1.plot(ax=axes[0], kind='barh', title="总面积_平方公里前三")
axes[0].set_xlabel("平方公里")
axes[0].set_ylabel("景点")
s2.plot(ax=axes[1], kind='barh', title="游客量_万人次.前三")
axes[1].set_xlabel("万人次")
axes[1].set_ylabel("景点")

fig.tight_layout()
plt.show()

fig, axes = plt.subplots(1, figsize=(10, 10))
df3.游客量_万人次.plot(ax=axes, kind='pie', title="河北省旅客量")
fig.tight_layout()
plt.show()
1.北京租房数据统计分析
主要内容:近年来随着经济的快速发展,一线城市的资源和就业机会吸引了很多外来人口,使其逐渐成为人口密集的城市之一,其中绝大多数人是以租房的形式解决居住问题,通过爬虫技术爬取链家网站中列出的租房信息(爬取结束时间为2019年9月10日),具体包括所属区域、小区名称、房屋价格、房屋面积、户型。将爬取的数据保存到“链家北京租房数据.csv”文件中,首先对数据进行读取,预处理、转换类型,以图表形式完成以下统计指标:
①统计每个区域的房源总数量,并使用热力图分析房源位置分布情况。
②使用条形图分析哪种户型的数量最多,更受欢迎。
③统计每个区域的平均租金,并结合柱状图和折线图分析各区域的房源数量和租金情况。
④统计面积区间的市场占有率,并使用饼状图绘制各区间所占的比例。
1.数据分析
# 数据准备
import numpy as np
import pandas as pd
import matplotlib as mpl
import matplotlib.pyplot as plt

df = pd.read_csv("链家北京租房数据_new.csv")
# print(df)
# ①统计每个区域的房源总数量,并使用热力图分析房源位置分布情况。
df1 = df.drop_duplicates()  # 去重后的数据
df1 = df1.dropna()  # 删除缺失数据,并重新赋值。
# print(df1)
df2 = df1[['Num']].groupby(df['区域']).count()
print(df2)
#排序后的房源数量统计
df3 = df2.sort_values(by=['Num'], ascending=False)
print(df3)
#
#
# ②使用条形图分析哪种户型的数量最多,更受欢迎。大于50的!
df4 = df1[['Num']].groupby(df['户型']).count().sort_values(by=['Num'], ascending=True)
df4 = df4[df4['Num'].astype(float) > 50]
# print(df4)
# 指定一个2*2布局的正方形画布
# 方法二:如果是在jupyter notebook里,设置下面两行才能显示中文
plt.rcParams['font.family'] = ['sans-serif']
# 如果是在 PyCharm 里,只要下面一行,上面的一行可以删除
plt.rcParams['font.sans-serif'] = ['SimHei']
df1 = df1.set_index('户型')  # 设置索引
fig, axes = plt.subplots(1, figsize=(10, 10))
s1 = df4.Num
s1.plot(ax=axes, kind='barh', title="户型", )
axes.set_xlabel("户型数量")
axes.set_ylabel("户型种类")
fig.tight_layout()
plt.legend()
plt.show()


# ③统计每个区域的平均租金,并结合柱状图和折线图分析各区域的房源数量和租金情况。
df5 = df[['价格_元_月']].groupby(df['区域']).mean()
print(df5)
# df5=df5.set_index('区域')#设置索引
# df2=df2.set_index('区域')#设置索引

# 指定一个2*2布局的正方形画布
# 方法二:如果是在jupyter notebook里,设置下面两行才能显示中文
plt.rcParams['font.family'] = ['sans-serif']
# 如果是在 PyCharm 里,只要下面一行,上面的一行可以删除
plt.rcParams['font.sans-serif'] = ['SimHei']
fig, axes = plt.subplots(2, 2, figsize=(10, 10))
s1 = df2.Num
s2 = df2.Num
s3 = df5.价格_元_月
s4 = df5.价格_元_月
s1.plot(ax=axes[0][0], kind='bar', title="各个区域房源统计")
axes[0][0].set_xlabel("区域")
axes[0][0].set_ylabel("单位(栋)")
s2.plot(ax=axes[0][1], kind='line', title="各个区域房源统计")
axes[0][1].set_xlabel("区域")
axes[0][1].set_ylabel("单位(栋)")
s3.plot(ax=axes[1][0], kind='bar', title="各个区域平均租金统计")
axes[1][0].set_xlabel("区域")
axes[1][0].set_ylabel("单位(元/月)")
s4.plot(ax=axes[1][1], kind='line', title="各个区域平均租金统计")
axes[1][1].set_xlabel("区域")
axes[1][1].set_ylabel("单位(元/月)")
fig.tight_layout()
plt.show()


# ④统计面积区间的市场占有率,并使用饼状图绘制各区间所占的比例。
fig, axes = plt.subplots(1, figsize=(10, 10))
df6 = df[['面积']]

df_0_50 = df6[df6['面积'] < 50]
df_50_100 = df6[df6['面积'] < 100]
df_100_150 = df6[df6['面积'] < 150]
print(df_0_50.count()['面积'])
print(df_50_100.count() - df_0_50.count())
print(df_100_150.count() - df_50_100.count())
recipe_data = [df_0_50.count()['面积'], df_50_100.count()['面积'] - df_0_50.count()['面积'], df_100_150.count()['面积'] - df_50_100.count()['面积']]
recipe_labels = ['统计面积区间1-50㎡', '统计面积区间50-100㎡', '统计面积区间100-150㎡' ]
plt.rc('font', family='Youyuan', size='9')
plt.rc('axes', unicode_minus='False')
explode = [0.1, 0.2, 0]  # 每个元素的膨胀距离,这里指定了第0和第1个
fig, ax = plt.subplots()
ax.pie(recipe_data, explode=explode, labels=recipe_labels, autopct='%1.1f%%', shadow=True, startangle=0)
# autopct 精度 startangle 第1个元素的起始角位置,其他元素逆时针方向组织,shadow 是否使用阴影
ax.axis('scaled')  # 设置饼图的样式,设置为equals显示的会是圆形
plt.show()
#
#
#
# fig, ax = plt.subplots(figsize=(12, 6))
# recipe_data = [df_0_50.count()['面积'], df_50_100.count()['面积'] - df_0_50.count()['面积'], df_100_150.count()['面积'] - df_50_100.count()['面积']]
# recipe_labels = ['统计面积区间1-50㎡', '统计面积区间50-100㎡', '统计面积区间100-150㎡' ]
# # 用来规定输出格式的函数
# def func(pct, allvals):
#     absolute = int(pct/100.*np.sum(allvals))
#     return "{:.1f}%\n({:d})".format(pct, absolute)
# # 颜色列表
# colors=['#06799f', '#4c8e9e','#3aaacf']
# wedges, texts, autotexts = ax.pie(x=recipe_data,
#                                   labels=recipe_labels,
#                                   # autopct='%1.1f%%',   autopct后面跟的两种形式  这种格式就是 像12.3%的百分比一位小数
#                                   autopct=lambda pct: func(pct ,recipe_data),
#                                   explode=explode,
#                                   colors=colors,
#                                   pctdistance=0.7,
#                                   textprops=dict(color="w"),  # 设置白色会看不到圆外部的文字(背景是白色)
#                                   # 设置环的比例占一半
#                                   wedgeprops = {'width': 0.5, 'linewidth': 1, 'edgecolor':'w'}
#                                   )
# # 设置图例中的一些属性
# ax.legend(wedges, recipe_labels,
#           title="legends",
#           title_fontsize=15,
#           fontsize=17,
#           loc="center left",
#           bbox_to_anchor=(1, 0, 0.5, 1))
# plt.setp(autotexts, size=12, weight="bold")    # 文字的大小之类
# ax.set_title("Pie Chart", fontdict={'fontsize':15, 'fontweight':15})
# plt.show()
2.热力图
<!DOCTYPE html>
<html>
<head>
    <meta http-equiv="Content-Type" content="text/html; charset=utf-8"/>
    <meta name="viewport" content="initial-scale=1.0, user-scalable=no"/>
    <script type="text/javascript"
            src="http://api.map.baidu.com/api?v=2.0&ak=Ls5WVYwsLLtCobV9oWaGO7Triqehi9P0"></script>
    <script type="text/javascript" src="http://api.map.baidu.com/library/Heatmap/2.0/src/Heatmap_min.js"></script>
    <script src="https://cdn.staticfile.org/jquery/1.10.2/jquery.min.js">
    </script>
    <title>热力图功能示例</title>
    <style type="text/css">
        ul, li {
            list-style: none;
            margin: 0;
            padding: 0;
            float: left;
        }

        html {
            height: 100%
        }

        body {
            height: 100%;
            margin: 0px;
            padding: 0px;
            font-family: "微软雅黑";
        }

        #container {
            height: 500px;
            width: 100%;
        }

        #r-result {
            width: 100%;
        }
    </style>
</head>
<body>
<div id="container"></div>
<div id="r-result">
    上传文件:<input type="file" name="file" multiple id="fileid">
    <button type="submit" id="btn" name="btn" onclick="check()">提交</button>
    <input type="button" onclick="openHeatmap();" value="显示热力图"/>
    <input type="button" onclick="closeHeatmap();" value="关闭热力图"/>
</div>
</body>
</html>
<script type="text/javascript">
    // 创建地图实例
    var map = new BMap.Map("container");
    //设置地图的中心点
    var point = new BMap.Point(116.44502461328744, 39.95413021745949);
    // 初始化地图,设置中心点坐标和地图级别
    map.centerAndZoom(point, 13);
    // 允许滚轮缩放
    map.enableScrollWheelZoom();

    var points = [];

    function check() {
        var objFile = document.getElementById("fileid");
        var files = $("#fileid").prop('files');
        console.log(files.length);
        if(files.length==0){
            alert("请选择文件")
        }else {
            for(var i=0;f=files[i];i++){
                var reader=new FileReader();
                reader.readAsText(files[i],"UTF-8");
                reader.onload=function (evt) {
                    points=jQuery.parseJSON(evt.target.result)
                    console.log(points)

                }
            }
        }
    }

    //判断浏览器是否支持canvas
    if (!isSupportCanvas()) {
        alert('热力图目前只支持有canvas支持的浏览器,您所使用的浏览器不能使用热力图功能~')
    }
    //热力图初始化
    heatmapOverlay1 = new BMapLib.HeatmapOverlay({"radius": 20});
    //地图添加热力图层
    map.addOverlay(heatmapOverlay1);
    //热力图层添加数据
    heatmapOverlay1.setDataSet({data: points, max: 100});
    //不知道作用
    //判断浏览区是否支持canvas
    function isSupportCanvas() {
        var elem = document.createElement('canvas');
        return !!(elem.getContext && elem.getContext('2d'));
    }

    //显示热力图
    function openHeatmap() {
        heatmapOverlay1.setDataSet({data:points,max:15})
        heatmapOverlay1.show();
    }

    //关闭热力图
    function closeHeatmap() {
        heatmapOverlay1.hide();
    }

    closeHeatmap();
</script>
</font>
总结
其乐无穷亦!
