2019独角兽企业重金招聘Python工程师标准>>> ![]()
想要测量一张图的连通性,这可以通过调用GraphX原生支持的triangleCount()来实现。但是如果想要对比多张图的连通性,这时又该如何呢?
Global clustering coefficient(全局聚类系数)
Another way to measure connectedness, the global clustering coefficient, is better in that it always returns a number between 0 and 1, making it possible to compare the connectedness of different sized graphs.
全局聚类系数通常定义如下:closed triplets / total triplets (open or closed)
A triplet in this case is a set of three vertices that have two or three edges among them. If there are three edges, then it’s a triangle, and this is called a closed triplet. If there are only two edges, then it’s called an open triplet. Triplets are counted for each vertex and then added all together; this means that a triangle will count as three closed triplets, because each of the three vertices will have one closed triplet associated with it.
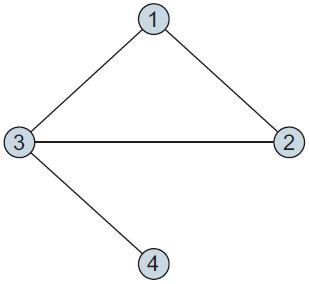
如图所示,存在与一个三角形相关联的三个闭合三元组:与顶点1相关联的一个闭合三元组(1-2-3),与顶点2相关联的一个闭合三元组(2-3-1),以及与顶点3相关联的一个闭合三元组(3-1-2)。另外,与顶点3相关联的还有两个开放三元组,即(1-3-4)和(2-3 -4)。所以,此图的全局聚类系数为{(1-2-3),(2-3-1),(3-1-2)} / {(1-2-3),(2-3-1),(3-1-2),(1-3-4),(2-3 -4)} = 3 / 5 = 0.6
计算全局聚类系数的代码如下:
  def globalClusteringCoefficient[VD: ClassTag, ED: ClassTag](g:Graph[VD, ED]) = {
    val numerator  = g.triangleCount().vertices.map(_._2).reduce(_ + _)
    val denominator = g.inDegrees.map{ case (_, d) => d*(d-1) / 2.0 }.reduce(_ + _)
    if(denominator == 0) 0.0 else numerator / denominator
  }
local clustering coefficient(局部聚类系数)
与全局聚类系数相对应,有一个局部聚类系数的概念。
that is the ratio of the actual triangle count at a vertex to the number of possible triangles at that vertex based on how many neighbors it has. For an undirected graph, the local clustering coefficient C for a vertex that has k neighbors and t triangles is: C = 2t / [ k * (k - 1) ]
计算局部聚类系数的代码如下:
  def localClusteringCoefficient[VD: ClassTag, ED: ClassTag](g: Graph[VD, ED]) = {
    val triCountGraph = g.triangleCount()
    val maxTrisGraph = g.inDegrees.mapValues(srcAttr => srcAttr*(srcAttr-1) / 2.0 )
    triCountGraph.vertices.innerJoin(maxTrisGraph){ (vid, a, b) => if(b == 0) 0 else a / b }
  }
network average clustering coefficient(网络平均聚类系数)
Computing the average value of the local clustering coefficient for all of the vertices in the graph gives us the network average clustering coefficient
测试代码如下:
    val vertices = sc.makeRDD(Seq((1L, ""), (1L, ""), (2L, ""), (3L, ""), (4L, ""), (4L, "")))
    val edges = sc.makeRDD(Seq(Edge(1L, 1L, ""), Edge(1L, 2L, ""), Edge(2L, 3L, ""), Edge(1L, 3L, ""), Edge(3L, 4L, ""))).filter(e => e.srcId != e.dstId).flatMap(e => Array(e, Edge(e.dstId, e.srcId, e.attr))).distinct()  //去掉自循环边,有向图变为无向图,去除重复边
    val testGraph =  Graph(vertices, edges).cache()
打印顶点:
testGraph.vertices.foreach(println)
输出结果如下:
(3,)
(1,)
(2,)
(4,)
从上述输出来看,不难发现GraphX自动为我们去除了重复顶点。
The vertices and edges arguments that we used to construct the Graph instance were regular RDDs—we didn’t even deduplicate the entries in the vertices so that there was only a single instance of each topic. Fortunately, the Graph API does this for us, converting the RDDs we passed in to a VertexRDD and an EdgeRDD, so that the vertex counts are now unique. Note that if there are duplicate entries in the EdgeRDD for a given pair of vertices, the Graph API will not deduplicate them: GraphX allows us to create multigraphs, which can have multiple edges with different values between the same pair of vertices. This can be useful in applications where the vertices in the graph represent rich objects, like people or businesses, that may have many different kinds of relationships between them (e.g., friends, family members, customers, partners, etc.). It also allows us to treat the edges as either directed or undirected, depending on the context.
计算全局聚类系数:
println(globalClusteringCoefficient2(testGraph))
输出如下:
0.6
计算局部聚类系数:
localClusteringCoefficient(testGraph).foreach(println)
输出如下:
(3,0.3333333333333333)
(1,1.0)
(2,1.0)
(4,0.0)
计算网络平均聚类系数:
println(localClusteringCoefficient(testGraph).map(_._2).sum() / testGraph.vertices.count())
输出如下:
0.5833333333333333
友情链接
