互联网招聘数据分析处理与可视化
数据分析与处理
数据预处理
import numpy as np
import pandas as pd
import matplotlib.pyplot as plt
import seaborn as sns
plt.rcParams['font.sans-serif']=['Simhei']#用来显示汉字
plt.rcParams['axes.unicode_minus']=False #用来显示负号
df=pd.read_excel('D:\\大学\\2020数据处理综合实训\\数据处理综合实训\jobs.xls')
数据分析
PYTHON
df1=df[df['job']=='python']
df1
| id | positionID | positionName | longitude | latitude | workYear | education | salary | city | jobNature | ... | industryField | companyShortName | companySize | companyLabelList | positionAdvantage | label_2 | label_3 | label_4 | job | district | |
|---|---|---|---|---|---|---|---|---|---|---|---|---|---|---|---|---|---|---|---|---|---|
| 0 | 1 | 1 | python | 113.264434 | 23.129162 | 1-3年 | 本科 | 10-15K | 广州 | 全职 | ... | 消费生活 | 省省回头车 | 150-500人 | “五险一金 年底双薪” | Golang | GO | NaN | NaN | python | 广州 |
| 1 | 2 | 2 | python | 113.264434 | 23.129162 | 3-5年 | 本科 | 15-25K | 广州 | 全职 | ... | 消费生活 | 省省回头车 | 150-500人 | “五险一金 年底双薪” | Golang | GO | NaN | NaN | python | 广州 |
| 2 | 3 | 3 | Python开发工程师 | 113.264434 | 23.129162 | 1-3年 | 本科 | 15-25K | 广州 | 全职 | ... | 移动互联网 | 悦谦科技 | 50-150人 | “双休,发展空间大,团队氛围好,扁平化管理” | 金融 | Python | 数据挖掘 | 图像算法 | python | 广州 |
| 3 | 4 | 4 | Python开发工程师 | 113.264434 | 23.129162 | 3-5年 | 本科 | 15-25K | 广州 | 全职 | ... | 移动互联网 | 悦谦科技 | 50-150人 | “双休 扁平化管理 发展平台好 团队氛围好” | 移动互联网 | 互联网金融 | Python | NaN | python | 广州 |
| 4 | 5 | 5 | python开发工程师 | 113.264434 | 23.129162 | 1-3年 | 大专 | 10-15K | 广州 | 全职 | ... | 移动互联网 | 广州游爱 | 500-2000人 | “双休,五险一金,包三餐,年底双薪” | 后端 | Python | NaN | NaN | python | 广州 |
| ... | ... | ... | ... | ... | ... | ... | ... | ... | ... | ... | ... | ... | ... | ... | ... | ... | ... | ... | ... | ... | ... |
| 38210 | 38211 | 38211 | 高级Python开发工程师 | 121.473701 | 31.230416 | 3-5年 | 本科 | 25K以上 | 上海 | 全职 | ... | 企业服务 | CloudChef | 50-150人 | “带薪年假,五险一金,团建旅游,补充公积金” | Python | Linux/Unix | MySQL | 云计算 | python | 上海 |
| 38211 | 38212 | 38212 | 中级Python开发工程师 | 121.473701 | 31.230416 | 3-5年 | 本科 | 15-25K | 上海 | 全职 | ... | 移动互联网 | NextTao 互道信息 | 50-150人 | “技术氛围浓郁 团队氛围轻松 发展空间大” | 新零售 | 企业服务 | 后端 | 分布式 | python | 上海 |
| 38212 | 38213 | 38213 | Python高级开发工程师 | 121.473701 | 31.230416 | 3-5年 | 本科 | 25K以上 | 上海 | 全职 | ... | 移动互联网 | NextTao 互道信息 | 50-150人 | “互联网零售革命的推动者” | 新零售 | Python | NaN | NaN | python | 上海 |
| 38213 | 38214 | 38214 | Python开发工程师 | 120.155070 | 30.274084 | 3-5年 | 本科 | 15-25K | 杭州 | 全职 | ... | 移动互联网 | 智云健康 | 500-2000人 | “前景行业,待遇丰厚” | python爬虫 | NaN | NaN | NaN | python | 杭州 |
| 38214 | 38215 | 38215 | Python开发工程师(兼职) | 113.264434 | 23.129162 | 应届 | 本科 | 5K以下 | 广州 | 兼职 | ... | 移动互联网 | 微宽信息 | 15-50人 | “兼职” | python爬虫 | NaN | NaN | NaN | python | 广州 |
38215 rows × 23 columns
df1.loc[df1['workYear']==' 不限','workYear']='不限'
df1.loc[df1['workYear']=='不限 ','workYear']='不限'
df1.loc[df1['workYear']==' 应届','workYear']='应届'
c:\users\13530\appdata\local\programs\python\python37\lib\site-packages\pandas\core\indexing.py:1765: SettingWithCopyWarning:
A value is trying to be set on a copy of a slice from a DataFrame.
Try using .loc[row_indexer,col_indexer] = value instead

See the caveats in the documentation: https://pandas.pydata.org/pandas-docs/stable/user_guide/indexing.html#returning-a-view-versus-a-copy
  isetter(loc, value)
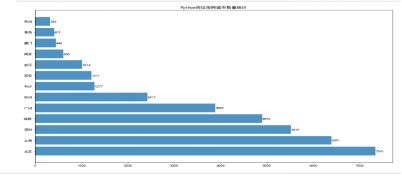
Python岗位按照城市数量统计
citys=df1['city'].value_counts()
citys
北京    7341
上海    6391
深圳    5519
成都    4895
广州    3889
      ...
盐城       1
贵港       1
钦州       1
南通       1
日照       1
Name: city, Length: 70, dtype: int64
plt.figure(figsize=(15,10))
citys=citys[citys.values>300]
citys_num=len(citys)
plt.barh(range(citys_num),citys.values,alpha=0.8)
plt.yticks(range(citys_num),list(citys.index))
plt.title('Python岗位按照城市数量统计')
for x,y in enumerate(citys):
    plt.text(y + 0.2, x - 0.1, '%s' % y)
plt.show()
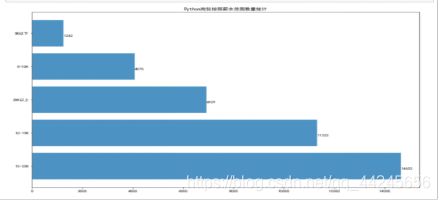
Python岗位按照薪水范围数量统计
Fare=df1['salary'].value_counts()
Fare
15-25K    14652
10-15K    11322
25K以上      6929
5-10K      4070
5K以下       1242
Name: salary, dtype: int64
plt.figure(figsize=(15,10))
Fare_num=len(Fare)
plt.barh(range(Fare_num),Fare.values,alpha=0.8)
plt.yticks(range(Fare_num),list(Fare.index))
plt.title('Python岗位按照薪水范围数量统计')
for x,y in enumerate(Fare):
    plt.text(y + 0.2, x - 0.1, '%s' % y)
plt.show()
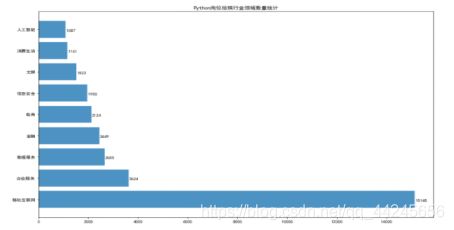
Python岗位按照行业领域数量统计
industryField=df1['industryField'].value_counts()
industryField
移动互联网        15145
企业服务          3624
数据服务          2655
金融            2449
电商            2124
信息安全          1950
文娱            1522
消费生活          1161
人工智能          1087
社交             958
游戏             900
教育             650
医疗             578
其他             544
硬件             544
通讯电子           497
软件开发           388
旅游             209
电子商务           165
物流             164
体育             154
工具             126
汽车             113
大数据             87
广告营销            81
房产家居            72
不限              62
区块链             56
电商、广告营销         53
物联网             40
企业服务、软件开发       13
金融、企业服务         11
数据服务、软件开发       10
物联网、软件开发         4
电商、社交            2
金融、软件开发          2
信息安全、数据服务        2
物联网、教育           2
软件开发、人工智能        1
硬件、通讯电子          1
企业服务、数据服务        1
人工智能、其他          1
社交、软件开发          1
消费生活、电商          1
电商、企业服务          1
数据服务、教育          1
信息安全、人工智能        1
金融、电商            1
软件开发、其他          1
Name: industryField, dtype: int64
plt.figure(figsize=(15,10))
industryField=industryField[industryField.values>1000]
industryField_num=len(industryField)
plt.barh(range(industryField_num),industryField.values,alpha=0.8)
plt.yticks(range(industryField_num),list(industryField.index))
plt.title('Python岗位按照行业领域数量统计')
for x,y in enumerate(industryField):
    plt.text(y + 20, x - 0.1, '%s' % y)
plt.show()
Python岗位按照公司规模数量统计
companySize=df1['companySize'].value_counts()
companySize
 150-500人      9835
 50-150人       8433
 2000人以上       8064
 500-2000人     5926
 15-50人        4925
 少于15人         1017
 少于50人            9
 2000-5000人       3
5679              2
 1000-9999人       1
Name: companySize, dtype: int64
plt.figure(figsize=(15,10))
#companySize=companySize[companySize.values>1000]
companySize_num=len(companySize)
plt.barh(range(companySize_num),companySize.values,alpha=0.8)
plt.yticks(range(companySize_num),list(companySize.index))
plt.title('Python岗位按照公司规模数量统计')
for x,y in enumerate(companySize):
    plt.text(y + 20, x - 0.1, '%s' % y)
plt.show()
Python岗位按照学历数量统计
education=df1['education'].value_counts()
education
本科    31142
大专     3706
不限     2327
硕士     1009
博士       31
Name: education, dtype: int64
plt.figure(figsize=(15,10))
education_num=len(education)
plt.barh(range(education_num),education.values,alpha=0.8)
plt.yticks(range(education_num),list(education.index))
plt.title('Python岗位按照学历数量统计')
for x,y in enumerate(education):
    plt.text(y + 20, x - 0.1, '%s' % y)
plt.show()
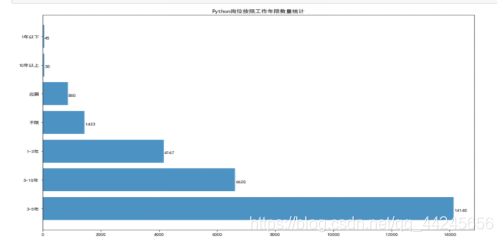
Python岗位按照工作年限数量统计
workYear=df1['workYear'].value_counts()
workYear
3-5年     18069
1-3年     10624
5-10年     3632
不限        3618
应届        2104
1年以下       105
10年以上       63
Name: workYear, dtype: int64
plt.figure(figsize=(15,10))
workYear_num=len(workYear)
plt.barh(range(workYear_num),workYear.values,alpha=0.8)
plt.yticks(range(workYear_num),list(workYear.index))
plt.title('Python岗位按照工作年限数量统计')
for x,y in enumerate(workYear):
    plt.text(y + 20, x - 0.1, '%s' % y)
plt.show()
Python岗位按照岗位标签数量统计
plt.figure(figsize=(15,10))
label_1=df1['positionAdvantage'].value_counts()
label_2=df1['label_2'].value_counts()
label_3=df1['label_3'].value_counts()
label_4=df1['label_4'].value_counts()
label=label_1+label_2+label_3+label_4
label=label[label.values>500]
label=label.sort_values()
label_num=len(label)
plt.barh(range(label_num),label.values,alpha=0.8)
plt.yticks(range(label_num),list(label.index))
plt.title('Python岗位按照工作年限数量统计')
for x,y in enumerate(label):
    plt.text(y + 0.2, x - 0.1, '%s' % y)
plt.show()
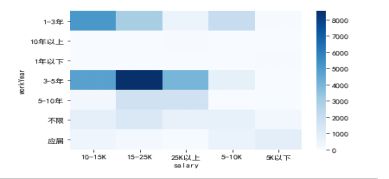
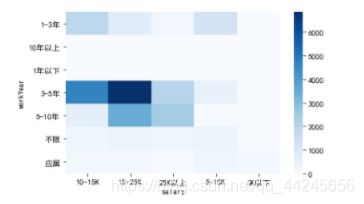
Python工作年限与工资薪水之间的相关关系
a=df1[['workYear','salary']]
a.apply(lambda x: x.factorize()[0]).corr()
| workYear | salary | |
|---|---|---|
| workYear | 1.000000 | 0.299888 |
| salary | 0.299888 | 1.000000 |
sns.heatmap(pd.crosstab(a.workYear,a.salary),cmap='Blues')
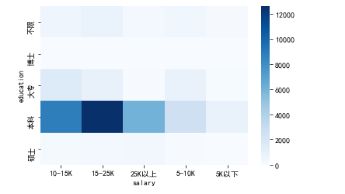
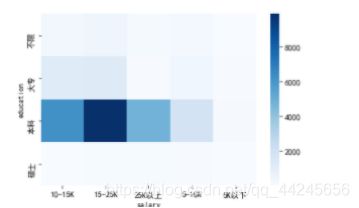
Python学历要求与工资薪水之间的相关关系
b=df1[['education','salary']]
b.apply(lambda x: x.factorize()[0]).corr()
| education | salary | |
|---|---|---|
| education | 1.000000 | 0.022579 |
| salary | 0.022579 | 1.000000 |
sns.heatmap(pd.crosstab(b.education,b.salary),cmap='Blues')
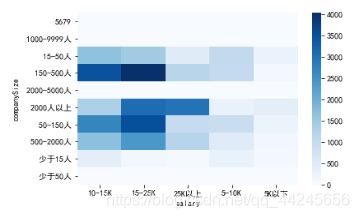
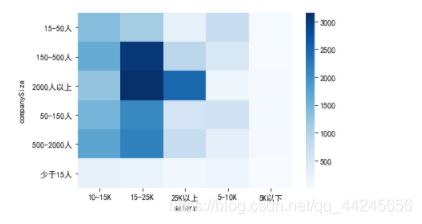
Python公司规模与工资薪水之间的相关关系
c=df1[['companySize','salary']]
c.apply(lambda x: x.factorize()[0]).corr()
| companySize | salary | |
|---|---|---|
| companySize | 1.000000 | 0.137736 |
| salary | 0.137736 | 1.000000 |
sns.heatmap(pd.crosstab(c.companySize,c.salary),cmap='Blues')
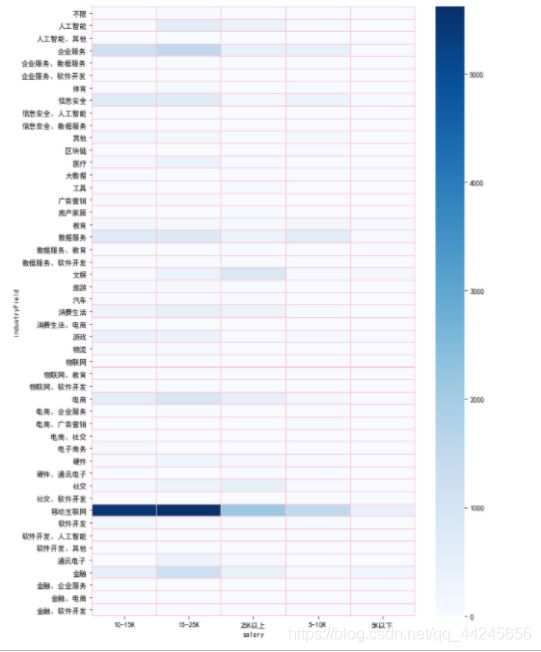
Python行业领域与工资薪水之间的相关关系
e=df1[['industryField','salary']]
e.apply(lambda x: x.factorize()[0]).corr()
| industryField | salary | |
|---|---|---|
| industryField | 1.000000 | 0.060122 |
| salary | 0.060122 | 1.000000 |
f,ax=plt.subplots(figsize=(10,15))
sns.heatmap(pd.crosstab(e.industryField,e.salary),ax=ax,linewidths=0.01,linecolor='pink',cmap='Blues')
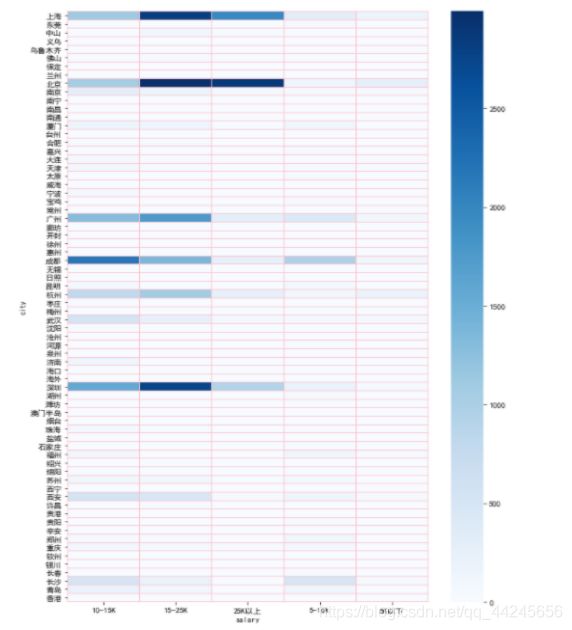
Python城市与工资薪水之间的相关关系
d=df1[['city','salary']]
d.apply(lambda x: x.factorize()[0]).corr()
| city | salary | |
|---|---|---|
| city | 1.000000 | -0.028087 |
| salary | -0.028087 | 1.000000 |
f,ax=plt.subplots(figsize=(10,15))
sns.heatmap(pd.crosstab(d.city,d.salary),ax=ax,linewidths=0.01,linecolor='pink',cmap='Blues')
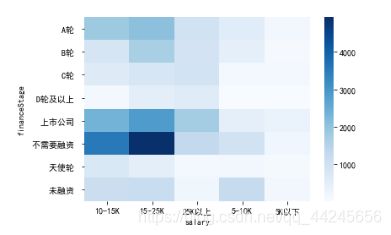
公司融资轮数与工资薪水之间的相关关系
f=df1[['financeStage','salary']]
f.apply(lambda x: x.factorize()[0]).corr()
| financeStage | salary | |
|---|---|---|
| financeStage | 1.000000 | 0.125897 |
| salary | 0.125897 | 1.000000 |
sns.heatmap(pd.crosstab(f.financeStage,f.salary),cmap='Blues')
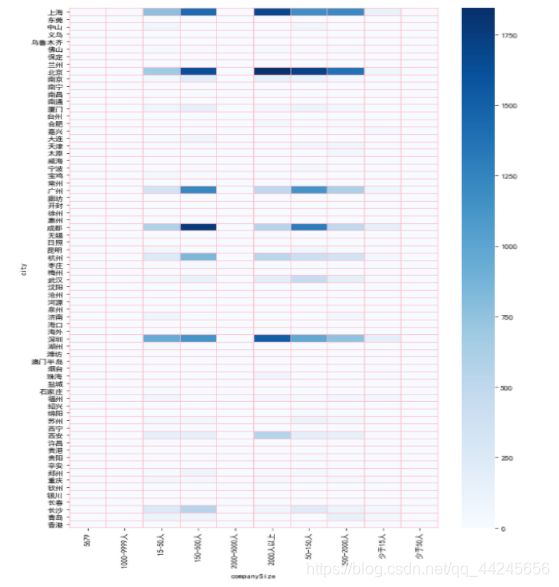
Python公司规模与工作城市之间的相关关系
g=df1[['companySize','city']]
g.apply(lambda x: x.factorize()[0]).corr()
| companySize | city | |
|---|---|---|
| companySize | 1.000000 | 0.068158 |
| city | 0.068158 | 1.000000 |
f,ax=plt.subplots(figsize=(10,15))
sns.heatmap(pd.crosstab(g.city,g.companySize),linewidths=0.01,linecolor='pink',cmap='Blues')
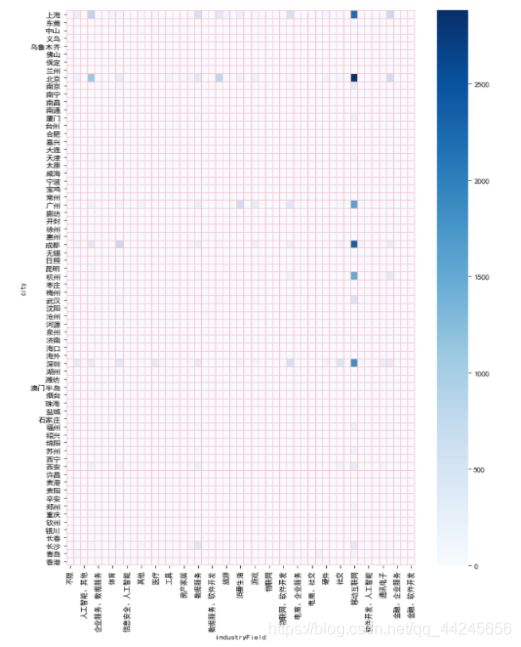
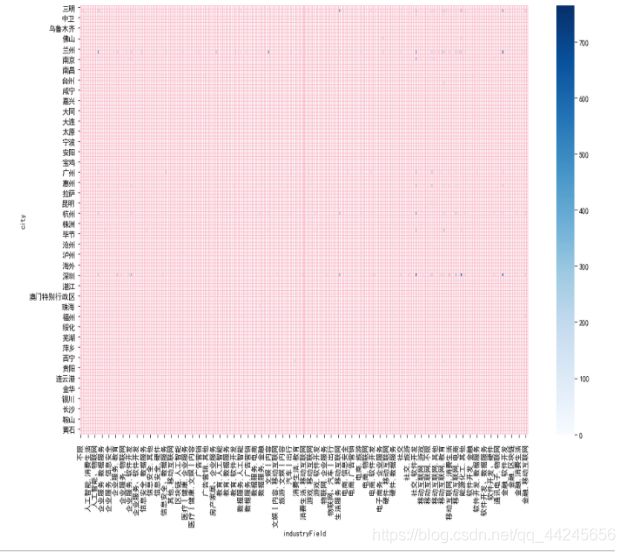
Python行业领域与工作城市之间的相关关系
h=df1[['industryField','city']]
h.apply(lambda x: x.factorize()[0]).corr()
| industryField | city | |
|---|---|---|
| industryField | 1.0000 | 0.0566 |
| city | 0.0566 | 1.0000 |
f,ax=plt.subplots(figsize=(10,15))
sns.heatmap(pd.crosstab(h.city,h.industryField),linewidths=0.01,linecolor='pink',cmap='Blues')
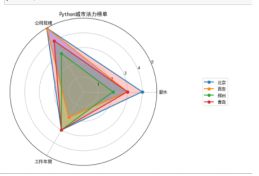
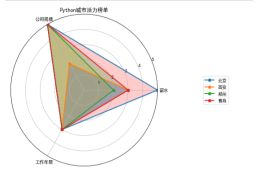
Python城市活力榜单
import numpy as np

# 替换薪水
df1.replace('5K以下', 1, inplace=True)
df1.replace('5-10K', 2, inplace=True)
df1.replace('10-15K', 3, inplace=True)
df1.replace('15-25K', 4, inplace=True)
df1.replace('25K以上', 5, inplace=True)
# 替换公司规模
df1.replace('少于50人', 1, inplace=True)
df1.replace(' 50-150人', 2, inplace=True)
df1.replace(' 150-500人', 3, inplace=True)
df1.replace(' 500-2000人', 4, inplace=True)
df1.replace(' 2000人以上', 5, inplace=True)
# 替换工作年限
df1.replace('1年以下', 1, inplace=True)
df1.replace('1-3年', 2, inplace=True)
df1.replace('3-5年', 3, inplace=True)
df1.replace('5-10年', 4, inplace=True)
df1.replace('10年以上', 5, inplace=True)
c:\users\13530\appdata\local\programs\python\python37\lib\site-packages\pandas\core\frame.py:4382: SettingWithCopyWarning:
A value is trying to be set on a copy of a slice from a DataFrame

See the caveats in the documentation: https://pandas.pydata.org/pandas-docs/stable/user_guide/indexing.html#returning-a-view-versus-a-copy
  method=method,
# 北京
beijing_values = []
beijing = df1[df1['city'] == '北京']
beijing_values.append(beijing['salary'].value_counts().index[0])
beijing_values.append(beijing['companySize'].value_counts().index[0])
beijing_values.append(beijing['workYear'].value_counts().index[0])
# 西安
xian_values = []
xian = df1[df1['city'] == '西安']
xian_values.append(xian['salary'].value_counts().index[0])
xian_values.append(xian['companySize'].value_counts().index[0])
xian_values.append(xian['workYear'].value_counts().index[0])
# 郑州
zhengzhou_values = []
zhengzhou = df1[df1['city'] == '郑州']
zhengzhou_values.append(zhengzhou['salary'].value_counts().index[0])
zhengzhou_values.append(zhengzhou['companySize'].value_counts().index[0])
zhengzhou_values.append(zhengzhou['workYear'].value_counts().index[0])
# 青岛
qingdao_values = []
qingdao = df1[df1['city'] == '青岛']
qingdao_values.append(qingdao['salary'].value_counts().index[0])
qingdao_values.append(qingdao['companySize'].value_counts().index[0])
qingdao_values.append(qingdao['workYear'].value_counts().index[0])
feature = ['薪水','公司规模','工作年限']
N = len(feature)
angles = np.linspace(0,2*np.pi,N,endpoint=False)

#使雷达图封闭起来
angles = np.concatenate((angles,[angles[0]]))
beijing = np.concatenate((beijing_values,[beijing_values[0]]))
xian = np.concatenate((xian_values,[xian_values[0]]))
zhengzhou = np.concatenate((zhengzhou_values,[zhengzhou_values[0]]))
qingdao = np.concatenate((qingdao_values,[qingdao_values[0]]))
#绘图
fig = plt.figure(figsize=(6, 6))
#设置为极坐标格式
ax = fig.add_subplot(111, polar=True)
#绘制折线图
ax.plot(angles,beijing,'o-',linewidth=2,label='北京')
ax.fill(angles,beijing,'r',alpha=0.2)

ax.plot(angles,xian,'o-',linewidth=2,label='西安')
ax.fill(angles,xian,'b',alpha=0.2)

ax.plot(angles,zhengzhou,'o-',linewidth=2,label='郑州')
ax.fill(angles,zhengzhou,'y',alpha=0.2)

ax.plot(angles,qingdao,'o-',linewidth=2,label='青岛')
ax.fill(angles,qingdao,'g',alpha=0.2)

#添加每个特质的标签
ax.set_thetagrids(angles[:3]*180/np.pi,feature)
#设置极轴范围
ax.set_ylim(0, 5)
#添加标题
plt.title('Python城市活力榜单')
plt.legend(loc='right', bbox_to_anchor=(1.5, 0.5))
#增加网格纸
ax.grid(True)
plt.show()
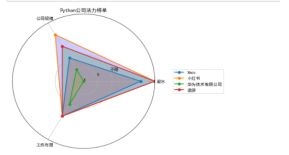
Python公司活力榜单
# Xmov
Xmov_values = []
Xmov = df1[df1['companyShortName'] == 'Xmov']
Xmov_values.append(Xmov['salary'].value_counts().index[0])
Xmov_values.append(Xmov['companySize'].value_counts().index[0])
Xmov_values.append(Xmov['workYear'].value_counts().index[0])
#小红书
book_values = []
book = df1[df1['companyShortName'] == '小红书']
book_values.append(book['salary'].value_counts().index[0])
book_values.append(book['companySize'].value_counts().index[0])
book_values.append(book['workYear'].value_counts().index[0])
# 华为技术有限公司
huawei_values = []
huawei = df1[df1['companyShortName'] == '华为技术有限公司']
huawei_values.append(huawei['salary'].value_counts().index[0])
huawei_values.append(huawei['companySize'].value_counts().index[0])
huawei_values.append(huawei['workYear'].value_counts().index[0])
# 途游
tuyou_values = []
tuyou = df1[df1['companyShortName'] == '途游']
tuyou_values.append(tuyou['salary'].value_counts().index[0])
tuyou_values.append(tuyou['companySize'].value_counts().index[0])
tuyou_values.append(tuyou['workYear'].value_counts().index[0])
feature = ['薪水','公司规模',"工作年限"]
N = len(feature)
angles = np.linspace(0,2*np.pi,N,endpoint=False)

#使雷达图封闭起来
angles = np.concatenate((angles,[angles[0]]))
Xmov = np.concatenate((Xmov_values,[Xmov_values[0]]))
book = np.concatenate((book_values,[book_values[0]]))
huawei = np.concatenate((huawei_values,[huawei_values[0]]))
tuyou = np.concatenate((tuyou_values,[tuyou_values[0]]))
#绘图
fig = plt.figure(figsize=(6, 6))
#设置为极坐标格式
ax = fig.add_subplot(111, polar=True)
#绘制折线图
ax.plot(angles,Xmov,'o-',linewidth=2,label='Xmov')
ax.fill(angles,Xmov,'r',alpha=0.2)

ax.plot(angles,book,'o-',linewidth=2,label='小红书')
ax.fill(angles,book,'b',alpha=0.2)

ax.plot(angles,huawei,'o-',linewidth=2,label='华为技术有限公司')
ax.fill(angles,huawei,'y',alpha=0.2)

ax.plot(angles,tuyou,'o-',linewidth=2,label='途游')
ax.fill(angles,tuyou,'g',alpha=0.2)

#添加每个特质的标签
ax.set_thetagrids(angles[:3]*180/np.pi,feature)
#设置极轴范围
ax.set_ylim(0,5)
#添加标题
plt.title('Python公司活力榜单')
plt.legend(loc='right', bbox_to_anchor=(1.5, 0.5))
#增加网格纸
ax.grid(True)
plt.show()
JAVA
df1=df[df['job']=='java']
df1
| id | positionID | positionName | longitude | latitude | workYear | education | salary | city | jobNature | ... | industryField | companyShortName | companySize | companyLabelList | positionAdvantage | label_2 | label_3 | label_4 | job | district | |
|---|---|---|---|---|---|---|---|---|---|---|---|---|---|---|---|---|---|---|---|---|---|
| 38215 | 38216 | 38216 | java开发工程师 | 106.551556 | 29.563009 | 1-3年 | 本科 | 10-15K | 重庆 | 全职 | ... | 人工智能,物联网 | 缺月智能 | 15-50人 | “团队氛围好、上升空间大、员工福利有保障” | Java | NaN | NaN | NaN | java | 重庆 |
| 38216 | 38217 | 38217 | Java开发工程师 | 108.940174 | 34.341568 | 5-10年 | 本科 | 15-25K | 西安 | 全职 | ... | 移动互联网,数据服务 | 销售易 | 500-2000人 | “腾讯领投、D+轮,六险一金,扁平化管理” | 即时通讯 | NaN | NaN | NaN | java | 西安 |
| 38217 | 38218 | 38218 | java开发工程师 | 121.473701 | 31.230416 | 3-5年 | 本科 | 15-25K | 上海 | 全职 | ... | 电商 | 中通快递 | 2000人以上 | “每年两次晋升机会,平台成熟” | 物流 | NaN | NaN | NaN | java | 上海 |
| 38218 | 38219 | 38219 | java开发工程师 | 114.305392 | 30.593098 | 3-5年 | 不限 | 10-15K | 武汉 | 全职 | ... | 移动互联网 | 朗蕴科技 | 15-50人 | “做五休二,五险一金” | J2EE | NaN | NaN | NaN | java | 武汉 |
| 38219 | 38220 | 38220 | java开发工程师 | 113.264434 | 23.129162 | 5-10年 | 本科 | 10-15K | 广州 | 全职 | ... | 其他 | 华谋-学府信息 | 150-500人 | “五险一金,周末双休,带薪年假,节日福利” | 后端 | NaN | NaN | NaN | java | 广州 |
| ... | ... | ... | ... | ... | ... | ... | ... | ... | ... | ... | ... | ... | ... | ... | ... | ... | ... | ... | ... | ... | ... |
| 65530 | 65531 | 65531 | java工程师 | 116.407526 | 39.904030 | 3-5年 | 本科 | 15-25K | 北京 | 全职 | ... | 数据服务,移动互联网 | trustdata | 15-50人 | “福利好,大牛多,氛围好” | 后端 | NaN | NaN | NaN | java | 北京 |
| 65531 | 65532 | 65532 | java开发工程师 | 116.407526 | 39.904030 | 3-5年 | 本科 | 15-25K | 北京 | 全职 | ... | 移动互联网 | 掌文 | 50-150人 | “带薪年假、季度奖金、团建活动、年度体检” | 软件开发 | NaN | NaN | NaN | java | 北京 |
| 65532 | 65533 | 65533 | Java开发工程师 | 116.407526 | 39.904030 | 应届 | 本科 | 10-15K | 北京 | 全职 | ... | 移动互联网,教育 | 易编科技 | 少于15人 | “一周工作四天,每天有效工作6小时。” | 电商 | NaN | NaN | NaN | java | 北京 |
| 65533 | 65534 | 65534 | java开发工程师 | 121.473701 | 31.230416 | 1-3年 | 大专 | 10-15K | 上海 | 全职 | ... | 移动互联网,企业服务 | 羿海科技 | 150-500人 | “五险一金 绩效奖金 加班补助” | 电商 | NaN | NaN | NaN | java | 上海 |
| 65534 | 65535 | 65535 | java开发工程师 | 114.057868 | 22.543099 | 3-5年 | 大专 | 15-25K | 深圳 | 全职 | ... | 移动互联网,企业服务 | 羿海科技 | 150-500人 | “五险一金 绩效奖金 加班补助” | 服务器端 | NaN | NaN | NaN | java | 深圳 |
27320 rows × 23 columns
df1.loc[df1['workYear']==' 不限','workYear']='不限'
df1.loc[df1['workYear']=='不限 ','workYear']='不限'
df1.loc[df1['workYear']==' 应届','workYear']='应届'
c:\users\13530\appdata\local\programs\python\python37\lib\site-packages\pandas\core\indexing.py:1765: SettingWithCopyWarning:
A value is trying to be set on a copy of a slice from a DataFrame.
Try using .loc[row_indexer,col_indexer] = value instead

See the caveats in the documentation: https://pandas.pydata.org/pandas-docs/stable/user_guide/indexing.html#returning-a-view-versus-a-copy
  isetter(loc, value)
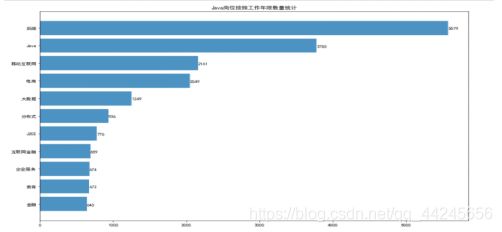
JAVA岗位按照城市数量统计
citys=df1['city'].value_counts()
citys
深圳      5734
北京      5209
上海      3563
杭州      2670
成都      1648
        ...
娄底         1
铜陵         1
蚌埠         1
晋城         1
博尔塔拉       1
Name: city, Length: 125, dtype: int64
plt.figure(figsize=(15,10))
citys=citys[citys.values>300]
citys_num=len(citys)
plt.barh(range(citys_num),citys.values,alpha=0.8)
plt.yticks(range(citys_num),list(citys.index))
plt.title('Java岗位按照城市数量统计')
for x,y in enumerate(citys):
    plt.text(y + 0.2, x - 0.1, '%s' % y)
plt.show()
JAVA岗位按照薪水范围数量统计
Fare=df1['salary'].value_counts()
Fare
15-25K    11770
10-15K     7712
25K以上      5102
5-10K      2479
5K以下        257
Name: salary, dtype: int64
plt.figure(figsize=(15,10))
Fare_num=len(Fare)
plt.barh(range(Fare_num),Fare.values,alpha=0.8)
plt.yticks(range(Fare_num),list(Fare.index))
plt.title('Java岗位按照薪水范围数量统计')
for x,y in enumerate(Fare):
    plt.text(y + 0.2, x - 0.1, '%s' % y)
plt.show()
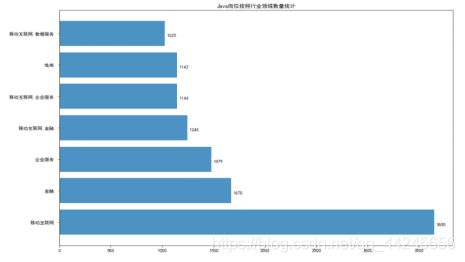
JAVA岗位按照行业领域数量统计
industryField=df1['industryField'].value_counts()
industryField
移动互联网          3650
金融             1670
企业服务           1479
移动互联网,金融       1245
移动互联网,企业服务     1144
               ...
体育、软件开发           1
文化娱乐 电子商务         1
人工智能,教育           1
数据服务 金融           1
企业服务、软件开发         1
Name: industryField, Length: 258, dtype: int64
plt.figure(figsize=(15,10))
industryField=industryField[industryField.values>1000]
industryField_num=len(industryField)
plt.barh(range(industryField_num),industryField.values,alpha=0.8)
plt.yticks(range(industryField_num),list(industryField.index))
plt.title('Java岗位按照行业领域数量统计')
for x,y in enumerate(industryField):
    plt.text(y + 20, x - 0.1, '%s' % y)
plt.show()
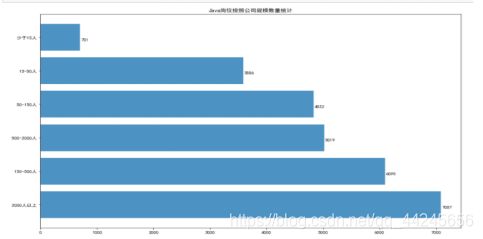
JAVA岗位按照公司规模数量统计
companySize=df1['companySize'].value_counts()
companySize
 2000人以上      7087
 150-500人     6095
 500-2000人    5019
 50-150人      4832
 15-50人       3586
 少于15人         701
Name: companySize, dtype: int64
plt.figure(figsize=(15,10))
#companySize=companySize[companySize.values>1000]
companySize_num=len(companySize)
plt.barh(range(companySize_num),companySize.values,alpha=0.8)
plt.yticks(range(companySize_num),list(companySize.index))
plt.title('Java岗位按照公司规模数量统计')
for x,y in enumerate(companySize):
    plt.text(y + 20, x - 0.1, '%s' % y)
plt.show()
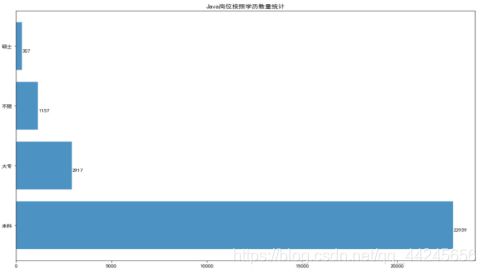
JAVA岗位按照学历数量统计
education=df1['education'].value_counts()
education
本科    22939
大专     2917
不限     1157
硕士      307
Name: education, dtype: int64
plt.figure(figsize=(15,10))
education_num=len(education)
plt.barh(range(education_num),education.values,alpha=0.8)
plt.yticks(range(education_num),list(education.index))
plt.title('Java岗位按照学历数量统计')
for x,y in enumerate(education):
    plt.text(y + 20, x - 0.1, '%s' % y)
plt.show()
JAVA岗位按照工作年限数量统计
workYear=df1['workYear'].value_counts()
workYear
3-5年     14140
5-10年     6620
1-3年      4167
不限        1433
应届         860
10年以上       55
1年以下        45
Name: workYear, dtype: int64
plt.figure(figsize=(15,10))
workYear_num=len(workYear)
plt.barh(range(workYear_num),workYear.values,alpha=0.8)
plt.yticks(range(workYear_num),list(workYear.index))
plt.title('Python岗位按照工作年限数量统计')
for x,y in enumerate(workYear):
    plt.text(y + 20, x - 0.1, '%s' % y)
plt.show()
JAVA岗位按照岗位标签数量统计
plt.figure(figsize=(15,10))
label=df1['positionAdvantage'].value_counts()
#label_2=df1['label_2'].value_counts()
#label_3=df1['label_3'].value_counts()
#label_4=df1['label_4'].value_counts()
#label=label_1+label_2+label_3+label_4
label=label[label.values>500]
label=label.sort_values()
label_num=len(label)
plt.barh(range(label_num),label.values,alpha=0.8)
plt.yticks(range(label_num),list(label.index))
plt.title('Java岗位按照工作年限数量统计')
for x,y in enumerate(label):
    plt.text(y + 0.2, x - 0.1, '%s' % y)
plt.show()
JAVA工作年限与工资薪水之间的相关关系
a=df1[['workYear','salary']]
a.apply(lambda x: x.factorize()[0]).corr()
| workYear | salary | |
|---|---|---|
| workYear | 1.000000 | 0.025818 |
| salary | 0.025818 | 1.000000 |
sns.heatmap(pd.crosstab(a.workYear,a.salary),cmap='Blues')
JAVA学历要求与工资薪水之间的相关关系
b=df1[['education','salary']]
b.apply(lambda x: x.factorize()[0]).corr()
| education | salary | |
|---|---|---|
| education | 1.000000 | -0.010061 |
| salary | -0.010061 | 1.000000 |
sns.heatmap(pd.crosstab(b.education,b.salary),cmap='Blues')
JAVA公司规模与工资薪水之间的相关关系
c=df1[['companySize','salary']]
c.apply(lambda x: x.factorize()[0]).corr()
| companySize | salary | |
|---|---|---|
| companySize | 1.0000 | 0.0103 |
| salary | 0.0103 | 1.0000 |
sns.heatmap(pd.crosstab(c.companySize,c.salary),cmap='Blues')
JAVA行业领域与工资薪水之间的相关关系
e=df1[['industryField','salary']]
e.apply(lambda x: x.factorize()[0]).corr()
| industryField | salary | |
|---|---|---|
| industryField | 1.000000 | 0.023247 |
| salary | 0.023247 | 1.000000 |
f,ax=plt.subplots(figsize=(10,15))
sns.heatmap(pd.crosstab(e.industryField,e.salary),ax=ax,linewidths=0.01,linecolor='pink',cmap='Blues')
JAVA城市与工资薪水之间的相关关系
d=df1[['city','salary']]
d.apply(lambda x: x.factorize()[0]).corr()
| city | salary | |
|---|---|---|
| city | 1.000000 | 0.129413 |
| salary | 0.129413 | 1.000000 |
f,ax=plt.subplots(figsize=(10,15))
sns.heatmap(pd.crosstab(d.city,d.salary),ax=ax,linewidths=0.01,linecolor='pink',cmap='Blues')
JAVA公司融资轮数与工资薪水之间的相关关系
f=df1[['financeStage','salary']]
f.apply(lambda x: x.factorize()[0]).corr()
| financeStage | salary | |
|---|---|---|
| financeStage | 1.00000 | -0.06504 |
| salary | -0.06504 | 1.00000 |
sns.heatmap(pd.crosstab(f.financeStage,f.salary),cmap='Blues')
JAVA公司规模与工作城市之间的相关关系
g=df1[['companySize','city']]
g.apply(lambda x: x.factorize()[0]).corr()
| companySize | city | |
|---|---|---|
| companySize | 1.000000 | -0.005961 |
| city | -0.005961 | 1.000000 |
f,ax=plt.subplots(figsize=(10,15))
sns.heatmap(pd.crosstab(g.city,g.companySize),linewidths=0.01,linecolor='pink',cmap='Blues')
JAVA行业领域与工作城市之间的相关关系
h=df1[['industryField','city']]
h.apply(lambda x: x.factorize()[0]).corr()
| industryField | city | |
|---|---|---|
| industryField | 1.000000 | 0.104283 |
| city | 0.104283 | 1.000000 |
f,ax=plt.subplots(figsize=(15,20))
sns.heatmap(pd.crosstab(h.city,h.industryField),linewidths=0.01,linecolor='pink',cmap='Blues')
JAVA城市活力榜单
import numpy as np

# 替换薪水
df1.replace('5K以下', 1, inplace=True)
df1.replace('5-10K', 2, inplace=True)
df1.replace('10-15K', 3, inplace=True)
df1.replace('15-25K', 4, inplace=True)
df1.replace('25K以上', 5, inplace=True)
# 替换公司规模
df1.replace('少于50人', 1, inplace=True)
df1.replace(' 50-150人', 2, inplace=True)
df1.replace(' 150-500人', 3, inplace=True)
df1.replace(' 500-2000人', 4, inplace=True)
df1.replace(' 2000人以上', 5, inplace=True)
# 替换工作年限
df1.replace('1年以下', 1, inplace=True)
df1.replace('1-3年', 2, inplace=True)
df1.replace('3-5年', 3, inplace=True)
df1.replace('5-10年', 4, inplace=True)
df1.replace('10年以上', 5, inplace=True)
c:\users\13530\appdata\local\programs\python\python37\lib\site-packages\pandas\core\frame.py:4382: SettingWithCopyWarning:
A value is trying to be set on a copy of a slice from a DataFrame

See the caveats in the documentation: https://pandas.pydata.org/pandas-docs/stable/user_guide/indexing.html#returning-a-view-versus-a-copy
  method=method,
# 北京
beijing_values = []
beijing = df1[df1['city'] == '北京']
beijing_values.append(beijing['salary'].value_counts().index[0])
beijing_values.append(beijing['companySize'].value_counts().index[0])
beijing_values.append(beijing['workYear'].value_counts().index[0])
# 西安
xian_values = []
xian = df1[df1['city'] == '西安']
xian_values.append(xian['salary'].value_counts().index[0])
xian_values.append(xian['companySize'].value_counts().index[0])
xian_values.append(xian['workYear'].value_counts().index[0])
# 郑州
zhengzhou_values = []
zhengzhou = df1[df1['city'] == '郑州']
zhengzhou_values.append(zhengzhou['salary'].value_counts().index[0])
zhengzhou_values.append(zhengzhou['companySize'].value_counts().index[0])
zhengzhou_values.append(zhengzhou['workYear'].value_counts().index[0])
# 青岛
qingdao_values = []
qingdao = df1[df1['city'] == '青岛']
qingdao_values.append(qingdao['salary'].value_counts().index[0])
qingdao_values.append(qingdao['companySize'].value_counts().index[0])
qingdao_values.append(qingdao['workYear'].value_counts().index[0])
feature = ['薪水','公司规模','工作年限']
N = len(feature)
angles = np.linspace(0,2*np.pi,N,endpoint=False)

#使雷达图封闭起来
angles = np.concatenate((angles,[angles[0]]))
beijing = np.concatenate((beijing_values,[beijing_values[0]]))
xian = np.concatenate((xian_values,[xian_values[0]]))
zhengzhou = np.concatenate((zhengzhou_values,[zhengzhou_values[0]]))
qingdao = np.concatenate((qingdao_values,[qingdao_values[0]]))
#绘图
fig = plt.figure(figsize=(6, 6))
#设置为极坐标格式
ax = fig.add_subplot(111, polar=True)
#绘制折线图
ax.plot(angles,beijing,'o-',linewidth=2,label='北京')
ax.fill(angles,beijing,'r',alpha=0.2)

ax.plot(angles,xian,'o-',linewidth=2,label='西安')
ax.fill(angles,xian,'b',alpha=0.2)

ax.plot(angles,zhengzhou,'o-',linewidth=2,label='郑州')
ax.fill(angles,zhengzhou,'y',alpha=0.2)

ax.plot(angles,qingdao,'o-',linewidth=2,label='青岛')
ax.fill(angles,qingdao,'g',alpha=0.2)

#添加每个特质的标签
ax.set_thetagrids(angles[:3]*180/np.pi,feature)
#设置极轴范围
ax.set_ylim(0, 5)
#添加标题
plt.title('Java城市活力榜单')
plt.legend(loc='right', bbox_to_anchor=(1.5, 0.5))
#增加网格纸
ax.grid(True)
plt.show()
JAVA公司活力榜单
# Xmov
Xmly_values = []
Xmly = df1[df1['companyShortName'] == '喜马拉雅']
Xmly_values.append(Xmly['salary'].value_counts().index[0])
Xmly_values.append(Xmly['companySize'].value_counts().index[0])
Xmly_values.append(Xmly['workYear'].value_counts().index[0])
#小红书
book_values = []
book = df1[df1['companyShortName'] == '小红书']
book_values.append(book['salary'].value_counts().index[0])
book_values.append(book['companySize'].value_counts().index[0])
book_values.append(book['workYear'].value_counts().index[0])
# 华为技术有限公司
huawei_values = []
huawei = df1[df1['companyShortName'] == '华为技术有限公司']
huawei_values.append(huawei['salary'].value_counts().index[0])
huawei_values.append(huawei['companySize'].value_counts().index[0])
huawei_values.append(huawei['workYear'].value_counts().index[0])
# 途游
Dd_values = []
Dd = df1[df1['companyShortName'] == '当当网']
Dd_values.append(Dd['salary'].value_counts().index[0])
Dd_values.append(Dd['companySize'].value_counts().index[0])
Dd_values.append(Dd['workYear'].value_counts().index[0])
feature = ['薪水','公司规模',"工作年限"]
N = len(feature)
angles = np.linspace(0,2*np.pi,N,endpoint=False)

#使雷达图封闭起来
angles = np.concatenate((angles,[angles[0]]))
Xmly = np.concatenate((Xmly_values,[Xmly_values[0]]))
book = np.concatenate((book_values,[book_values[0]]))
huawei = np.concatenate((huawei_values,[huawei_values[0]]))
Dd = np.concatenate((Dd_values,[Dd_values[0]]))
#绘图
fig = plt.figure(figsize=(6, 6))
#设置为极坐标格式
ax = fig.add_subplot(111, polar=True)
#绘制折线图
ax.plot(angles,Xmly,'o-',linewidth=2,label='喜马拉雅')
ax.fill(angles,Xmly,'r',alpha=0.2)

ax.plot(angles,book,'o-',linewidth=2,label='小红书')
ax.fill(angles,book,'b',alpha=0.2)

ax.plot(angles,huawei,'o-',linewidth=2,label='华为技术有限公司')
ax.fill(angles,huawei,'y',alpha=0.2)

ax.plot(angles,Dd,'o-',linewidth=2,label='当当网')
ax.fill(angles,Dd,'g',alpha=0.2)

#添加每个特质的标签
ax.set_thetagrids(angles[:3]*180/np.pi,feature)
#设置极轴范围
ax.set_ylim(0,5)
#添加标题
plt.title('Java公司活力榜单')
plt.legend(loc='right', bbox_to_anchor=(1.5, 0.5))
#增加网格纸
ax.grid(True)
plt.show()

df1=df[df['job']=='python']
df1
| id | positionID | positionName | longitude | latitude | workYear | education | salary | city | jobNature | ... | industryField | companyShortName | companySize | companyLabelList | positionAdvantage | label_2 | label_3 | label_4 | job | district | |
|---|---|---|---|---|---|---|---|---|---|---|---|---|---|---|---|---|---|---|---|---|---|
| 0 | 1 | 1 | python | 113.264434 | 23.129162 | 1-3年 | 本科 | 10-15K | 广州 | 全职 | ... | 消费生活 | 省省回头车 | 150-500人 | “五险一金 年底双薪” | Golang | GO | NaN | NaN | python | 广州 |
| 1 | 2 | 2 | python | 113.264434 | 23.129162 | 3-5年 | 本科 | 15-25K | 广州 | 全职 | ... | 消费生活 | 省省回头车 | 150-500人 | “五险一金 年底双薪” | Golang | GO | NaN | NaN | python | 广州 |
| 2 | 3 | 3 | Python开发工程师 | 113.264434 | 23.129162 | 1-3年 | 本科 | 15-25K | 广州 | 全职 | ... | 移动互联网 | 悦谦科技 | 50-150人 | “双休,发展空间大,团队氛围好,扁平化管理” | 金融 | Python | 数据挖掘 | 图像算法 | python | 广州 |
| 3 | 4 | 4 | Python开发工程师 | 113.264434 | 23.129162 | 3-5年 | 本科 | 15-25K | 广州 | 全职 | ... | 移动互联网 | 悦谦科技 | 50-150人 | “双休 扁平化管理 发展平台好 团队氛围好” | 移动互联网 | 互联网金融 | Python | NaN | python | 广州 |
| 4 | 5 | 5 | python开发工程师 | 113.264434 | 23.129162 | 1-3年 | 大专 | 10-15K | 广州 | 全职 | ... | 移动互联网 | 广州游爱 | 500-2000人 | “双休,五险一金,包三餐,年底双薪” | 后端 | Python | NaN | NaN | python | 广州 |
| ... | ... | ... | ... | ... | ... | ... | ... | ... | ... | ... | ... | ... | ... | ... | ... | ... | ... | ... | ... | ... | ... |
| 38210 | 38211 | 38211 | 高级Python开发工程师 | 121.473701 | 31.230416 | 3-5年 | 本科 | 25K以上 | 上海 | 全职 | ... | 企业服务 | CloudChef | 50-150人 | “带薪年假,五险一金,团建旅游,补充公积金” | Python | Linux/Unix | MySQL | 云计算 | python | 上海 |
| 38211 | 38212 | 38212 | 中级Python开发工程师 | 121.473701 | 31.230416 | 3-5年 | 本科 | 15-25K | 上海 | 全职 | ... | 移动互联网 | NextTao 互道信息 | 50-150人 | “技术氛围浓郁 团队氛围轻松 发展空间大” | 新零售 | 企业服务 | 后端 | 分布式 | python | 上海 |
| 38212 | 38213 | 38213 | Python高级开发工程师 | 121.473701 | 31.230416 | 3-5年 | 本科 | 25K以上 | 上海 | 全职 | ... | 移动互联网 | NextTao 互道信息 | 50-150人 | “互联网零售革命的推动者” | 新零售 | Python | NaN | NaN | python | 上海 |
| 38213 | 38214 | 38214 | Python开发工程师 | 120.155070 | 30.274084 | 3-5年 | 本科 | 15-25K | 杭州 | 全职 | ... | 移动互联网 | 智云健康 | 500-2000人 | “前景行业,待遇丰厚” | python爬虫 | NaN | NaN | NaN | python | 杭州 |
| 38214 | 38215 | 38215 | Python开发工程师(兼职) | 113.264434 | 23.129162 | 应届 | 本科 | 5K以下 | 广州 | 兼职 | ... | 移动互联网 | 微宽信息 | 15-50人 | “兼职” | python爬虫 | NaN | NaN | NaN | python | 广州 |
38215 rows × 23 columns
df1.loc[df1['workYear']==' 不限','workYear']='不限'
df1.loc[df1['workYear']=='不限 ','workYear']='不限'
df1.loc[df1['workYear']==' 应届','workYear']='应届'
c:\users\13530\appdata\local\programs\python\python37\lib\site-packages\pandas\core\indexing.py:1765: SettingWithCopyWarning:
A value is trying to be set on a copy of a slice from a DataFrame.
Try using .loc[row_indexer,col_indexer] = value instead

See the caveats in the documentation: https://pandas.pydata.org/pandas-docs/stable/user_guide/indexing.html#returning-a-view-versus-a-copy
  isetter(loc, value)
Python岗位的职位描述进行分析,分析工作内容
import os
path='D:\\大学\\2020数据处理综合实训\\数据处理综合实训\\job_data'
files=os.listdir(path)#得到文件夹下的所有文件名称
txts=[]
for file in files:#遍历文件夹
    position=path+'\\'+file#构造绝对路径
    #print(position)
    with open(position,'r',encoding='utf-8') as f:
        data=f.read()#读取文件
        txts.append(data)
txts=','.join(txts)#转化为非数组类型
print(txts)
岗位职责


1、负责集成各种维度的数据源,使用各种数据获取技巧,转换、分析、调度、存储数据,为公司业务提供正确稳定的数据;
2、负责建设高可靠、高并发的分布式系统;
3、负责提升系统的稳定性,持续迭代更新,保证系统质量和交付及时性;
4、负责编写相关的技术文档和单元测试,对产品质量负责。


岗位要求


1、统招本科及以上学历,具备英语读写能力;
2、熟悉 Git/GitHub,通信协议 TCP/HTTP 及 RESTful 标准;
3、五年及以上 Python 开发工作经验,有 Scrapy 等使用经验;
4、有 MySQL, Redis 或 MongoDB 等相关数据库使用经验;
5、有数据意识,有产品数据方面相关经验。


加分项


1、有 CI/CD使用经验 ;
2、有使用 Docker、Kubernetes、AWS 或 GCP 等经验;
3、熟悉 Tornado、Django 或 Flask ;
4、有写 Blog 的习惯,活跃于技术社区,参与开源项目等;
5、有代码洁癖,对代码精益求精,对技术有极客热情;
6、有软件著作权申请,有专利发明申请。,职责描述:
1. 负责算法平台模块的开发维护工作
2. 负责核心技术问题的攻关,架构设计,系统优化,协助解决项目开发过程中的技术难题
3. 与算法工程师紧密配合,共同创造稳定可靠的算法项目
……
……
……
d={'开发':0,'测试':0,'设计':0,'维护':0,'实现':0,'修复':0,'编写':0,'Python':0,'处理':0,'SQL':0,
   '爬虫':0,'多线程':0,'监控':0,'优化':0,'框架':0}
num=txts.count('开发')
d['开发']=num
num=txts.count('测试')
d['测试']=num
num=txts.count('设计')
d['设计']=num
num=txts.count('维护')
d['维护']=num
num=txts.count('实现')
d['实现']=num
num=txts.count('修复')
d['修复']=num
num=txts.count('编写')
d['编写']=num
num=txts.count('Python')
d['Python']=num
num=txts.count('处理')
d['处理']=num
num=txts.count('SQL')
d['SQL']=num
num=txts.count('爬虫')
d['爬虫']=num
num=txts.count('多线程')
d['多线程']=num
num=txts.count('监控')
d['监控']=num
num=txts.count('优化')
d['优化']=num
num=txts.count('框架')
d['框架']=num
d
{'开发': 171,
 '测试': 29,
 '设计': 57,
 '维护': 19,
 '实现': 17,
 '修复': 2,
 '编写': 17,
 'Python': 43,
 '处理': 16,
 'SQL': 28,
 '爬虫': 12,
 '多线程': 6,
 '监控': 5,
 '优化': 35,
 '框架': 41}
from wordcloud import WordCloud
wc = WordCloud(
    max_words=500,  # 最多显示词数
    # max_font_size=100,  # 字体最大值
    background_color="white",  # 设置背景为白色,默认为黑色
    width = 1500,  # 设置图片的宽度
    height= 960,  # 设置图片的高度
    margin= 10,  # 设置图片的边缘
    #font_path=’./fonts/simhei.ttf’
    font_path='msyh.ttc')
wc.generate_from_frequencies(d)  # 从字典生成词云
plt.imshow(wc)  # 显示词云
plt.axis('off')  # 关闭坐标轴
plt.show()  # 显示图像

d={'本科':0,'英语':0,'经验':0,'HTML5':0,'CSS3':0,'RBAC':0,'django':0,'Python':0,'SQL':0,
   '沟通':0,'JavaScript':0,'Linux':0,'前端':0,'HTTP':0,'计算机':0}
num=txts.count('本科')
d['本科']=num
num=txts.count('英语')
d['英语']=num
num=txts.count('经验')
d['经验']=num
num=txts.count('HTML5')
d['HTML5']=num
num=txts.count('CSS3')
d['CSS3']=num
num=txts.count('RBAC')
d['RBAC']=num
num=txts.count('django')
d['django']=num
num=txts.count('Python')
d['Python']=num
num=txts.count('SQL')
d['SQL']=num
num=txts.count('沟通')
d['沟通']=num
num=txts.count('JvaScript')
d['JavaScript']=num
num=txts.count('Linux')
d['Linux']=num
num=txts.count('前端')
d['前端']=num
num=txts.count('HTTP')
d['HTTP']=num
num=txts.count('计算机')
d['计算机']=num
d
{'本科': 29,
 '英语': 5,
 '经验': 92,
 'HTML5': 3,
 'CSS3': 3,
 'RBAC': 1,
 'django': 10,
 'Python': 43,
 'SQL': 28,
 '沟通': 21,
 'JavaScript': 0,
 'Linux': 15,
 '前端': 12,
 'HTTP': 9,
 '计算机': 27}
wc = WordCloud(
    max_words=500,  # 最多显示词数
    # max_font_size=100,  # 字体最大值
    background_color="white",  # 设置背景为白色,默认为黑色
    width = 1500,  # 设置图片的宽度
    height= 960,  # 设置图片的高度
    margin= 10,  # 设置图片的边缘
    #font_path=’./fonts/simhei.ttf’
    font_path='msyh.ttc')
wc.generate_from_frequencies(d)  # 从字典生成词云
plt.imshow(wc)  # 显示词云
plt.axis('off')  # 关闭坐标轴
plt.show()  # 显示图像

附加内容
import jieba
path='D:\\大学\\2020数据处理综合实训\\数据处理综合实训\\job_data'
files=os.listdir(path)#得到文件夹下的所有文件名称
result=''
for file in files:
    position=path+'\\'+file#构造绝对路径
    with open(position,'r',encoding='utf-8') as f:
        lines=f.readlines()
        for index,line in enumerate(lines):
            if '岗位要求'in line or '任职要求'in line or '任职资格'in line:
                for line in lines[1:index]:
                    result +=line.strip('\n')
with open ('停用词表.txt','r',encoding='utf-8')as f:
    stop =f.read()
words=jieba.lcut_for_search(result)
word_list=[]
for word in words:
    if len(word)>1 and word not in stop:
        word_list.append(word)
keyword1=set(word_list)
result=''
for file in files:
    position=path+'\\'+file#构造绝对路径
    with open(position,'r',encoding='utf-8') as f:
        lines=f.readlines()
        for index,line in enumerate(lines):
            if '岗位要求'in line or '任职要求'in line:
                for line in lines[index+1:]:
                    result +=line.strip('\n')
words=jieba.lcut_for_search(result)
word_list=[]
for word in words:
    if len(word)>1 and word not in stop:
        word_list.append(word)
keyword2=set(word_list)
jiao=keyword1&keyword2
keyword1_alone=keyword1-jiao
keyword2_alone=keyword2-jiao
keyword1_count=0
keyword2_count=0
str_='''1、本科及以上学历,熟悉Python语言,有3年以上的实际 Python Web 开发经验;
2、熟练掌握 Python Web开发框架Django ;
3、熟悉Postgresql/Redis/MongoDB等数据库及相关操作;
4、熟悉Linux 操作系统及基础命令,熟悉Shell;
5、熟悉Docker,能使用docker部署应用python/django项目;
6、具备较强的学习能力和责任心,良好的沟通能力、文档编写能力;
7、为团队引入创新的技术、创新的解决方案,用创新的思路解决问题;
8、对现存或未来系统进行宏观的思考,规划形成统一的组件、框架或平台
9、较好的产品意识,愿意将产品效果做为工作最重要的驱动因素
10、良好的设计和编码规范,热爱写代码'''
words=jieba.lcut_for_search(str_)
for word in words:
    if word in keyword1_alone:
        keyword1_count += 1
#         print(word)
    if word in keyword2_alone:
#         print(word)
        keyword2_count += 1
if keyword1_count > keyword2_count:
    print('***********职位描述************')
else:
    print('***********任职要求************')
***********任职要求************
Web可视化
from pyecharts.charts import Bar
from pyecharts.globals import ThemeType
df=pd.read_excel('D:\\大学\\2020数据处理综合实训\\数据处理综合实训\jobs.xls')
df1=df[df['job']=='python']
df1
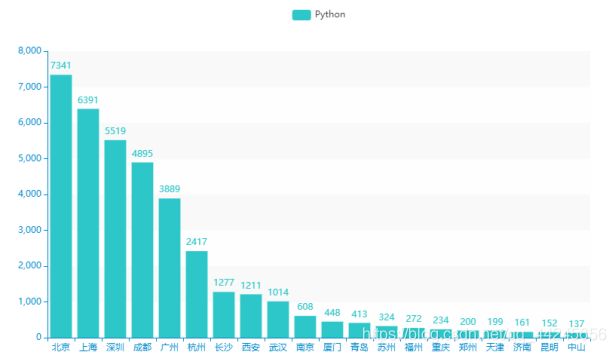
PY_city=df1['city'].value_counts()
PY_city=PY_city.head(20)
c=(
    Bar({'theme':ThemeType.MACARONS})
    .add_xaxis(PY_city.index.tolist())
    .add_yaxis('Python',PY_city.values.tolist())
    .set_global_opts(
        title_opts={'t]ext':'语言与城市'})
    .render('语言与城市.html'))