编写 matlab_在MATLAB的APP中编写GUI
2020A版和2015版相比,GUI设计差别很大,在2020版中,设计GUI要简单多了,下面给一个简单例子:根据底部的两个按钮分别绘制正弦曲线和余弦曲线,其中的滑动条可以调整绘制的周期数,数据编辑框显示当前选定的周期数。
先看运行的结果之一

要在APP中编写GUI程序,需要打开APP Designer,在2020A版,操作如下

不熟悉的可以参照实例教程,在这里可以自己设计,有现成的模板可供选用。

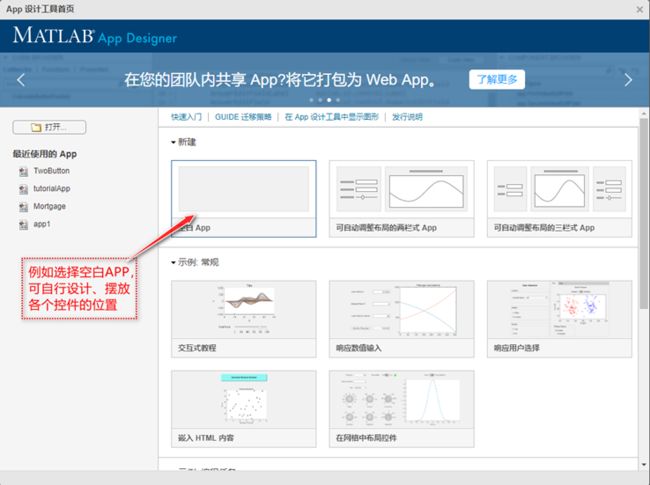
下面是实例设计

在设计时,将左侧的控件拖至空白板上,右侧会显示该控件的各种常规设置,包括默认值等的设定,颜色、标签内容等。并生成类的属性数据。在代码视图下,可根据我们学习过的面向对象知识,添加属性、设计方法、响应事件等。

在撰写代码时, 所有属性和方法的使用,都是以app.开头,例如,要在轴框里绘图,则需要指定轴框,代码如下:
plot( app.UIAxes, x, y, 'b-', 'linewidth', 1);
在设定绘图的各项操作中,也需首先指定轴框,例如title函数的使用格式如下:
title(app.UIAxes, 'Draw acos curve!', 'Color', 'b');
在代码视图中,能够编写的代码,会以白色背景显示;而通过视图形式设定的各个控件的属性,由于是私有方法,所以在代码视图中,均为灰色不可修改。下面逐一给出APP所在的类函数代码。


运行之二

源码如下:存放在扩展名为.mlapp文件中
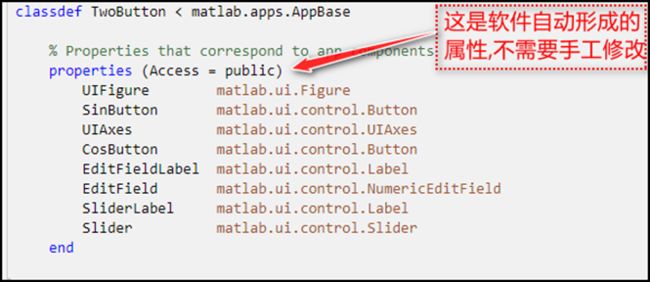
classdef TwoButton < matlab.apps.AppBase
%Properties that correspond to app components
properties (Access = public)
UIFigure matlab.ui.Figure
SinButton matlab.ui.control.Button
UIAxes matlab.ui.control.UIAxes
CosButton matlab.ui.control.Button
EditFieldLabel matlab.ui.control.Label
EditField matlab.ui.control.NumericEditField
SliderLabel matlab.ui.control.Label
Slider matlab.ui.control.Slider
end
properties (Access = public)
typestr % the curve name.
loop
end
methods (Access = private)
function PlotWave(app)
app.loop=app.Slider.Value; % 获取周期值
if isempty(app.typestr) %设定默认绘图曲线
app.typestr='sin';
end
x=0:0.01:2*(app.loop*pi);
switch app.typestr
case 'sin'
y=sin(x);
plot(app.UIAxes,x,y,'r-','linewidth',1);
title(app.UIAxes,'Draw asin curve!','Color','r');
case 'cos'
y=cos(x);
plot(app.UIAxes,x,y,'b-','linewidth',1);
title(app.UIAxes,'Draw acos curve!','Color','b');
end
app.EditField.Value=app.Slider.Value;
end
end
%Callbacks that handle component events
methods (Access = private)
% Button pushed function: SinButton
function SinButtonPushed(app, event)
app.typestr='sin';
PlotWave(app);
end
% Button pushed function: CosButton
function CosButtonPushed(app, event)
app.typestr='cos';
PlotWave(app);
end
% Value changed function: Slider
function SliderValueChanged(app, event)
app.loop = app.Slider.Value;
PlotWave(app);
end
end
%Component initialization
methods (Access = private)
% Create UIFigure and components
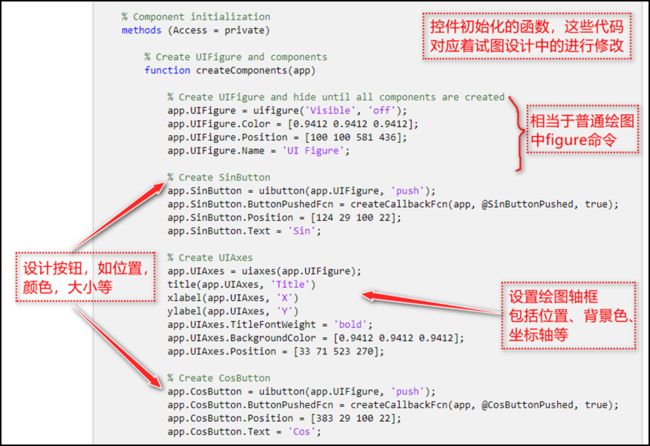
function createComponents(app)
% Create UIFigure and hide until all components are created
app.UIFigure = uifigure('Visible', 'off');
app.UIFigure.Color = [0.9412 0.9412 0.9412];
app.UIFigure.Position = [100 100 581 436];
app.UIFigure.Name = 'UI Figure';
% Create SinButton
app.SinButton = uibutton(app.UIFigure, 'push');
app.SinButton.ButtonPushedFcn = createCallbackFcn(app, @SinButtonPushed,true);
app.SinButton.Position = [124 29 100 22];
app.SinButton.Text = 'Sin';
% Create UIAxes
app.UIAxes = uiaxes(app.UIFigure);
title(app.UIAxes, 'Title')
xlabel(app.UIAxes, 'X')
ylabel(app.UIAxes, 'Y')
app.UIAxes.TitleFontWeight = 'bold';
app.UIAxes.BackgroundColor = [0.9412 0.9412 0.9412];
app.UIAxes.Position = [33 71 523 270];
% Create CosButton
app.CosButton = uibutton(app.UIFigure, 'push');
app.CosButton.ButtonPushedFcn = createCallbackFcn(app, @CosButtonPushed,true);
app.CosButton.Position = [383 29 100 22];
app.CosButton.Text = 'Cos';
% Create EditFieldLabel
app.EditFieldLabel = uilabel(app.UIFigure);
app.EditFieldLabel.HorizontalAlignment = 'right';
app.EditFieldLabel.Position = [419 382 64 22];
app.EditFieldLabel.Text = '当前周期 =';
% Create EditField
app.EditField = uieditfield(app.UIFigure, 'numeric');
app.EditField.Limits = [0 Inf];
app.EditField.ValueDisplayFormat = '%.2f';
app.EditField.HorizontalAlignment = 'center';
app.EditField.Position = [490 382 66 22];
app.EditField.Value = 10;
% Create SliderLabel
app.SliderLabel = uilabel(app.UIFigure);
app.SliderLabel.HorizontalAlignment = 'right';
app.SliderLabel.Position = [35 382 53 22];
app.SliderLabel.Text = '设定周期';
% Create Slider
app.Slider = uislider(app.UIFigure);
app.Slider.Limits = [0 20];
app.Slider.MajorTicks = [0 2 4 6 8 10 12 14 16 18 20];
app.Slider.ValueChangedFcn = createCallbackFcn(app, @SliderValueChanged,true);
app.Slider.MinorTicks = [0 0.5 1 1.5 2 2.5 3 3.5 4 4.5 5 5.5 6 6.5 7 7.58 8.5 9 9.5 10 10.5 11 11.5 12 12.5 13 13.5 14 14.5 15 15.5 16 16.5 17 17.5 1818.5 19 19.5 20];
app.Slider.Position = [109 391 267 3];
app.Slider.Value = 10;
% Show the figure after all components are created
app.UIFigure.Visible = 'on';
end
end
%App creation and deletion
methods (Access = public)
% Construct app
function app = TwoButton
% Create UIFigure and components
createComponents(app)
% Register the app with App Designer
registerApp(app, app.UIFigure)
if nargout == 0
clear app
end
end
% Code that executes before app deletion
function delete(app)
% Delete UIFigure when app is deleted
delete(app.UIFigure)
end
end
end