python量化策略——Fama-French三因子模型
- 介绍:Fama-French三因子模型,是Fama和French 1992年对美国股票市场决定不同股票回报率差异的因素的研究发现,股票的市场的beta值不能解释不同股票回报率的差异,而上市公司的市值、账面市值比、市盈率可以解释股票回报率的差异。Fama and French 认为,上述超额收益是对CAPM 中β未能反映的风险因素的补偿。这三个因子是:市场资产组合(Rm− Rf)、市值因子(SMB)、账面市值比因子(HMI)。这个多因子均衡定价模型可以表示为:
E ( R i t ) − R f t = β i E [ R m t − R f t ] + s i E ( S M B t ) + h i E ( H M I i ) E(R_{it})-R_{ft}=\beta_{i}E[R_{mt}-R_{ft}]+s_{i}E(SMB_{t})+h_{i}E(HMI_{i}) E(Rit)−Rft=βiE[Rmt−Rft]+siE(SMBt)+hiE(HMIi)
其中, R f t R_{ft} Rft 表示无风险收益率, R m t R_{mt} Rmt表示时间 t t t的市场收益率, R i t R_{it} Rit表示资产 i i i在时间 t t t的收益率,
E ( R m t ) − R f t E(R_{mt})-R_{ft} E(Rmt)−Rft是市场风险溢价, S M B T SMB_{T} SMBT表示时间 t t t的市值市值因子的模拟组合收益率, H M I t HMI_{t} HMIt为时间 t t t的账面市值比因子的组合收益率。 β i , s i , h i \beta_{i},s_{i},h_{i} βi,si,hi是三因子的系数。此外真实收益 :
R i t = E ( R i t ) − α i R_{it}=E(R_{it})-\alpha_{i} Rit=E(Rit)−αi
这样我们可以得到如下回归模型:
R i t − R f t = α i + β i ( R m t − R f t ) + s i S M B I t + h i H M I t + ϵ i t R_{it}-R_{ft}=\alpha_{i}+\beta_{i}(R_{mt}-R_{ft})+s_{i}SMBI_{t}+hiHMI_{t}+\epsilon_{it} Rit−Rft=αi+βi(Rmt−Rft)+siSMBIt+hiHMIt+ϵit
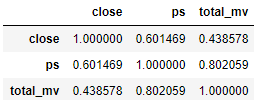
,我们选取市经率的倒数 1 / p b 1/pb 1/pb作为 H M I HMI HMI、总市值total_mv为 S M B SMB SMB和资产历史收益率 R i t R_{it} Rit作为三因子进行回归。
随便选一只股票查看他们的相关关系
# coding=utf-8
import math
import tushare as ts
import pandas as pd
import matplotlib
import matplotlib.pyplot as plt
import numpy as np
import talib
import pandas as pd
from datetime import datetime, date
matplotlib.rcParams['axes.unicode_minus']=False
plt.rcParams['font.sans-serif']=['SimHei']
ts.set_token('。。。。。')
pro = ts.pro_api()
df=pro.query('daily_basic', ts_code='600300.SH',fields='close,ts_code,ps,total_mv')
df.corr()
代码运行需里获取token码
完整代码
# coding=utf-8
import math
import tushare as ts
import pandas as pd
import matplotlib
import matplotlib.pyplot as plt
import numpy as np
import talib
import pandas as pd
from datetime import datetime, date
from sklearn import datasets
from sklearn.model_selection import train_test_split
import matplotlib.pyplot as plt
from sklearn.linear_model import LinearRegression

matplotlib.rcParams['axes.unicode_minus']=False
plt.rcParams['font.sans-serif']=['SimHei']
ts.set_token('f3e00efb72token  码11477')
pro = ts.pro_api()


############################读取数据类###################################
class readData:

    def read_index_daily(self,code,star,end):#指数数据
        dsb = pro.index_daily(ts_code=code, start_date=star, end_date=end,fields='ts_code,trade_date,close,change')#默认读取三个数据
        return dsb
    def read_daily(self,code,star,end):
        dsc1 = pro.daily(ts_code=code, start_date=star, end_date=end,fields='ts_code,trade_date,close')
        return dsc1
    def read_CPI(self,star,end):#时间格式start_cpi='201609'
        dc=pro.cn_cpi(start_m=star, end_m=end,fields='month,nt_yoy')
        return dc
    def read_GDP(self,star,end):#时间格式star='2016Q4'
        df1 = pro.cn_gdp(start_q=star, end_q=end,fields='quarter,gdp_yoy')
        return df1
    def read_bond(self,code,star,end):
        df=pro.cb_daily(ts_code=code,start_date=star,end_date=end)
    def read_base(self,code):
        df=pro.query('daily_basic', ts_code=code,fields='close,ts_code,pb,total_mv,trade_date')
        return df
#####################################################################

start_time='20200110'#发布GDP需要时间,我们延迟1个月,即第一季度的GDP4月份才发布。
end_time="20200331"
dc=readData()
dsc1=readData()
dsb1=readData()

def alpha_fun(code):
    dsb=dsb1.read_base(code) .fillna(0)
    dsc=dsc1.read_index_daily('000300.SH',start_time,end_time)
    dsc.set_index(['trade_date'],inplace=True)
    dsb.set_index(['trade_date'],inplace=True)
    df=pd.merge(dsc, dsb, on='trade_date').fillna(0)
    R=np.reshape(   np.array([df.close_y]) , (-1,1) )
    R_f=np.reshape(     np.array([  (df.change/(df.close_x.shift(-1))).fillna(0)  ])   , (-1,1)      )#用0 填充nan
    HMI=np.reshape(    np.array([ (1/df.pb).fillna(0)    ])                              , (-1,1) )
    SMB=np.reshape(    np.array([ df.total_mv]) , (-1,1) )
    X=np.concatenate((    R_f-4/252, HMI,SMB   ),axis=1)
    y1=np.reshape(R,(1,-1)).T
    X_train, X_test, y_train, y_test = train_test_split(X, y1, test_size=0.3, random_state=0)
    linear = LinearRegression()
    linear.fit(X_train, y_train)
    alpha=linear.intercept_-4/252
    return alpha,linear.intercept_ ,linear.coef_,linear.score(X_test, y_test),df


def Sy_function(df1,star,end):
    df=pro.query('daily', ts_code=df1, start_date=star, end_date=end,fields='')
    df=df.sort_index()
    df.index=pd.to_datetime(df.trade_date,format='%Y-%m-%d')#设置日期索引
    ret=df.change/df.close.shift(-1)
    dd=pd.Series(1,index=df.close.index)
    cumqq=ret*dd.shift(1).fillna(0)
    cum=(np.cumprod(1+ret[cumqq.index[0:]])-1)#等权重配置一篮子股票
    return cum.fillna(0),ret.fillna(0)


co=pro.query('daily_basic', ts_code="",trade_date="20200203",fields='ts_code')
code_list=[]
N=300#股票池
k=0
ret=0
cum=0
for i in co.ts_code.values[0:N]:
    try:
        if alpha_fun(i)[0]<-10:
            k+=1
            ret=Sy_function( str(i) ,start_time,end_time)[1]+ret

    except ValueError:
        pass
    continue
ret=ret.sort_index(axis=0,ascending=True)
cum=np.cumprod(1+ret)-1#
RET=ret/k


####################计算收益率函数,如沪深300#####################################
def JZ_function(code,star,end):
    df12 = pro.index_daily( ts_code=code, start_date=star, end_date=end)
    df12=df12.sort_index( )
    df12.index=pd.to_datetime(df12.trade_date,format='%Y-%m-%d')#设置日期索引
    ret12=df12.change/df12.close.shift(-1)
    #将顺序颠倒
    aq=pd.Series(1,index=df12.close.index)
    SmaRet=ret12*aq.shift(1).dropna()
    cum12=np.cumprod(1+ret12[SmaRet.index[0:]])-1
    return cum12


#############################策略的年化统计######################################
def Tongji(RET,cum):
    RET1 = RET*100 - (4/252)
    NH=cum[-2]*100*252/len(RET.index)
    BD=np.std(RET)*100*np.sqrt(252)
    SR=(NH-400/252)/BD
    for i in range(len(cum)):
        if cum[cum.index[i]]==cum.max():
            MHC=(cum.max()-cum[cum.index[i:]].min())*100/cum.max()
    print("年化收益率:{:.2f}%:,年化夏普率:{:.2f},波动率为:{:.2f}%,最大回撤:{:.2f}%".format( NH,SR,BD,MHC))
############################################################################

if __name__=="__main__":
    cum12=JZ_function('000300.SH',start_time,end_time)
    Tongji(RET,cum)
    plt.plot(cum12,label="沪深300",color='b')
    plt.plot(cum,label="股票组合",color='r')
    plt.title("alpha股+指期对冲策略")
    plt.legend()


#a=alpha_fun('600300.SH')
#print("alpha:{}".format(  a[0]   ))
#print('f截距:{}'.format(a[1]))
#print(f'系数:{a[2]}')
#print(f'准确率:{a[3]:.4f}')
FF三因子(改进代码+结果)
参考资料:
https://baike.so.com/doc/4284549-4487889.html
