数据集分布的可视化
数据集分布的可视化
%matplotlib inline
import numpy as np
import pandas as pd
from scipy import stats, integrate
import matplotlib.pyplot as plt
import seaborn as sns
sns.__version__
'0.8.1'
sns.set(color_codes=True)
np.random.seed(sum(map(ord, "distributions")))  # 随机数生成种子
单变量分布图
直方图
x = np.random.normal(size=100)
sns.distplot(x);
[外链图片转存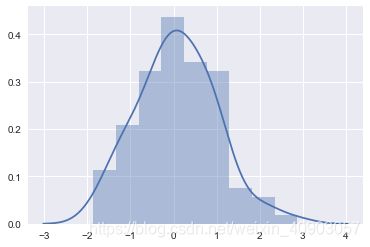 (img-mCZOOurt-1562742948663)(output_7_0.png)]
# sns.distplot?
sns.distplot(x, kde=False, rug=True);

# kde, 是否画核密度曲线
# rug,是否将数组中的数据点画出来作为坐标轴的刻度线
[外链图片转存 (img-CIY9zIhA-1562742948664)(output_9_0.png)]
# 自定义组数
sns.distplot(x, bins=30, kde=True, rug=True);
[外链图片转存 (img-izrfCRzd-1562742948665)(output_10_0.png)]
sns.distplot(x, hist=False, rug=True);
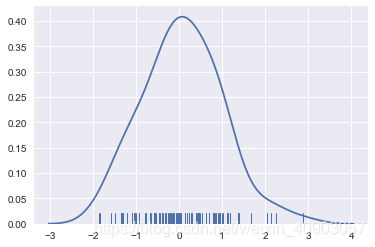
[外链图片转存失败(img-mjw7nQf5-1562742948665)(output_11_0.png)]
x = np.random.normal(0, 1, size=10)
bandwidth = 1.06 * x.std() * x.size ** (-1 / 5.)
support = np.linspace(-4, 4, 200)

kernels = []
for x_i in x:
    kernel = stats.norm(x_i, bandwidth).pdf(support)
    kernels.append(kernel)
    plt.plot(support, kernel, color="r")  # matplotlib 直接绘图核密度曲线

sns.rugplot(x, color=".3", linewidth=1);

[外链图片转存失败(img-zW7HpZzc-1562742948665)(output_12_0.png)]
# sns.rugplot?
# 将数组中的数据点画出来作为坐标轴的刻度线
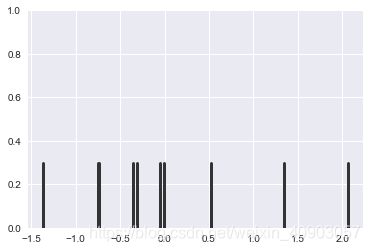
sns.rugplot(x, color=".2", height=0.3, linewidth=3);
[外链图片转存失败(img-LLGscZJL-1562742948666)(output_14_0.png)]
len(kernels[0])
200
density = np.sum(kernels, axis=0)
density.shape
(200,)
density /= integrate.trapz(density, support) # 使用复合梯形法则沿着给定的轴进行积分
plt.plot(support, density);
[外链图片转存失败(img-shdLXgsn-1562742948666)(output_17_0.png)]
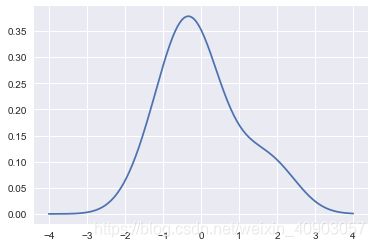
核密度估计图
sns.kdeplot(x, shade=True);
[外链图片转存失败(img-ov1H7D8y-1562742948666)(output_19_0.png)]
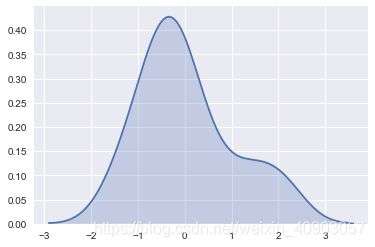
# sns.kdeplot?
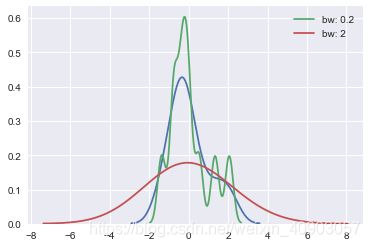
sns.kdeplot(x)
sns.kdeplot(x, bw=.2, label="bw: 0.2")
sns.kdeplot(x, bw=2, label="bw: 2")
plt.legend();
[外链图片转存失败(img-f0efM7u2-1562742948667)(output_21_0.png)]
拟合参数分布
x = np.random.gamma(6, size=200)
sns.distplot(x, kde=True, fit=stats.gamma);
[外链图片转存失败(img-FxH7xuJk-1562742948667)(output_23_0.png)]

二元分布图
mean, cov = [0, 1], [(1, .5), (.5, 1)]
data = np.random.multivariate_normal(mean, cov, 200)
df = pd.DataFrame(data, columns=["x", "y"])
df.head()
| x | y | |
|---|---|---|
| 0 | -0.167552 | -0.161169 |
| 1 | -0.105026 | 0.259424 |
| 2 | -0.434865 | 0.794962 |
| 3 | 1.707337 | 1.431573 |
| 4 | 0.710896 | 1.972702 |
散点图
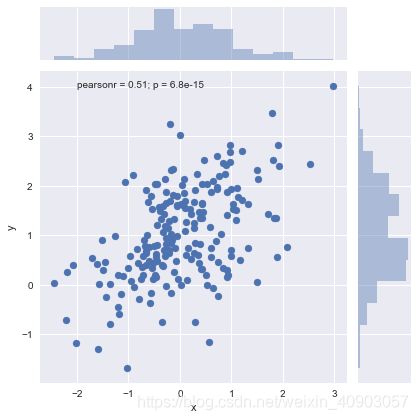
sns.jointplot(x="x", y="y", data=df);
[外链图片转存失败(img-uupG9fRq-1562742948667)(output_27_0.png)]
# sns.jointplot?
# kind: { "scatter" | "reg" | "resid" | "kde" | "hex" }
# sns.JointGrid?
g = sns.JointGrid(x="x", y="y", data=df)
g = g.plot_joint(plt.scatter, color="g", edgecolor="k")
g = g.plot_marginals(sns.distplot, kde=True, color="b")
[外链图片转存失败(img-HUNjD3ca-1562742948667)(output_30_0.png)]

Hexbin 图
x, y = np.random.multivariate_normal(mean, cov, 1000).T
with sns.axes_style("white"):
    sns.jointplot(x=x, y=y, kind="hex", color="k")
#     plt.title('Hexbin chart')
[外链图片转存失败(img-8ezB6rl9-1562742948668)(output_32_0.png)]

核密度估计
sns.jointplot(x="x", y="y", data=df, kind="kde");
[外链图片转存失败(img-z9QA4fYo-1562742948668)(output_34_0.png)]

# 二变量的核密度估计图
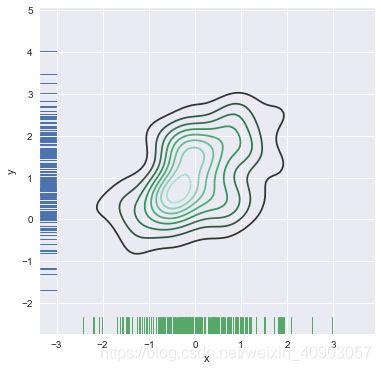
f, ax = plt.subplots(figsize=(6, 6))
sns.kdeplot(df.x, df.y, ax=ax)
sns.rugplot(df.x, color="g", ax=ax)
sns.rugplot(df.y, vertical=True, ax=ax);
[外链图片转存失败(img-OeyNTZ5D-1562742948668)(output_35_0.png)]
g = sns.jointplot(x="x", y="y", data=df, kind="kde", color="b")
g.plot_joint(plt.scatter, c="w", s=30, linewidth=1, marker="*")
g.set_axis_labels("$X$", "$Y$");
[外链图片转存失败(img-WO8mhqDU-1562742948668)(output_36_0.png)]

可视化数据集中成对的关系
pairplot
iris = sns.load_dataset("iris")
iris.head()
| sepal_length | sepal_width | petal_length | petal_width | species | |
|---|---|---|---|---|---|
| 0 | 5.1 | 3.5 | 1.4 | 0.2 | setosa |
| 1 | 4.9 | 3.0 | 1.4 | 0.2 | setosa |
| 2 | 4.7 | 3.2 | 1.3 | 0.2 | setosa |
| 3 | 4.6 | 3.1 | 1.5 | 0.2 | setosa |
| 4 | 5.0 | 3.6 | 1.4 | 0.2 | setosa |
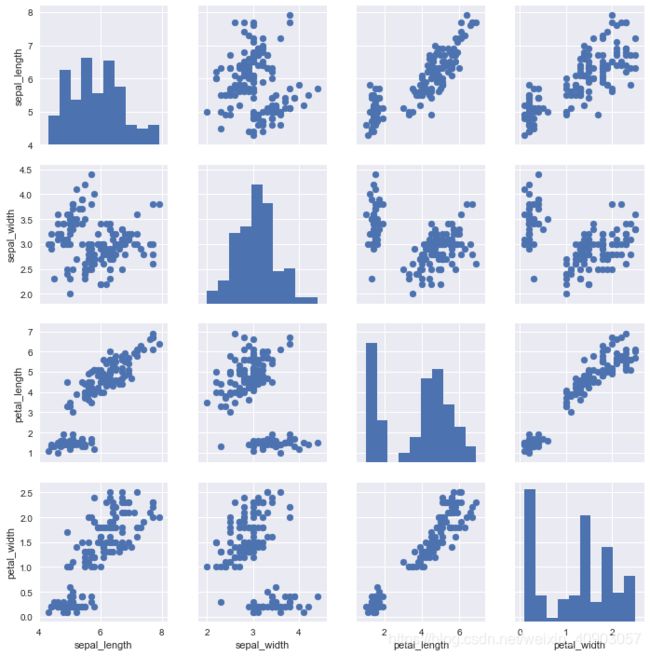
sns.pairplot(iris);
[外链图片转存失败(img-NPHZcR6F-1562742948669)(output_40_0.png)]

# sns.pairplot?
PairGrid
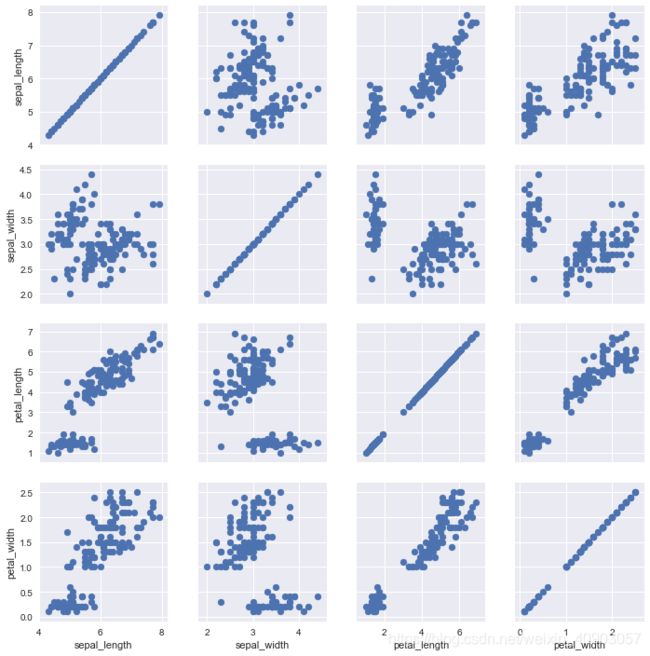
g = sns.PairGrid(iris)
g.map(plt.scatter);
[外链图片转存失败(img-MZqKT0fM-1562742948669)(output_43_0.png)]
g = sns.PairGrid(iris)
g.map_diag(plt.hist)
g.map_offdiag(plt.scatter);
[外链图片转存失败(img-1ZBhZE30-1562742948669)(output_44_0.png)]
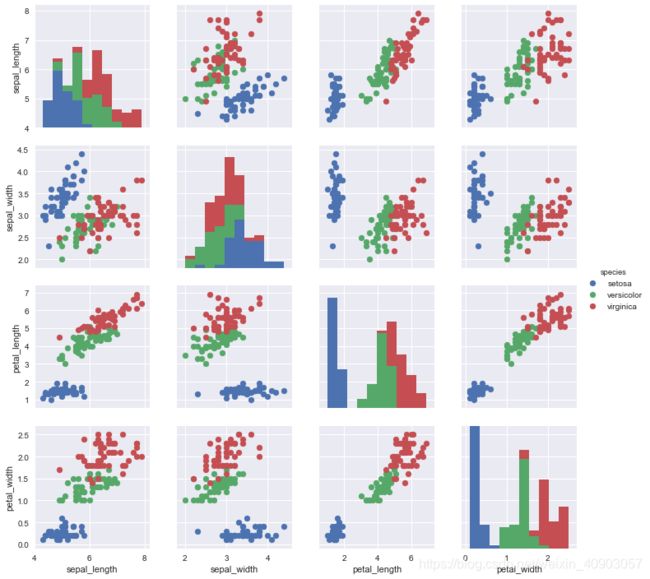
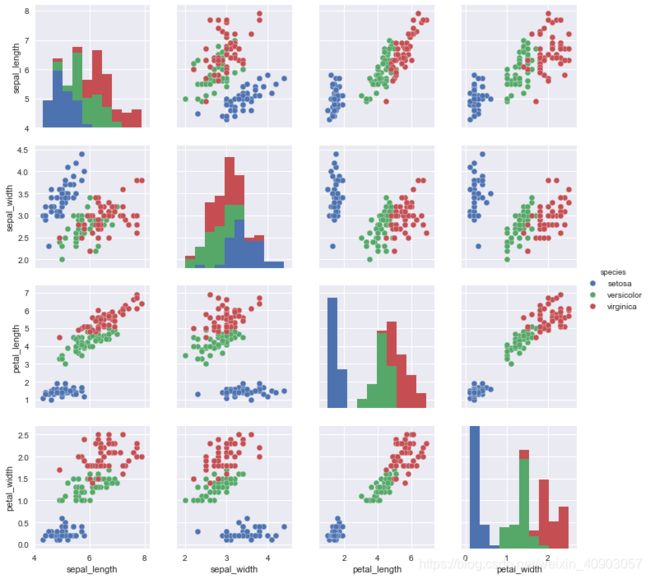
g = sns.PairGrid(iris, hue="species")
g.map_diag(plt.hist)
g.map_offdiag(plt.scatter)
g.add_legend();
[外链图片转存失败(img-JHFp4mdz-1562742948670)(output_45_0.png)]
sns.pairplot(iris, hue="species", size=2.5);
[外链图片转存失败(img-xn9d6NfE-1562742948670)(output_46_0.png)]
g = sns.PairGrid(iris, hue="species", palette="Set2", size=2.5)
g.map_diag(sns.kdeplot)
g.map_offdiag(plt.scatter)
g.add_legend();
[外链图片转存失败(img-tDCLFGzn-1562742948670)(output_47_0.png)]
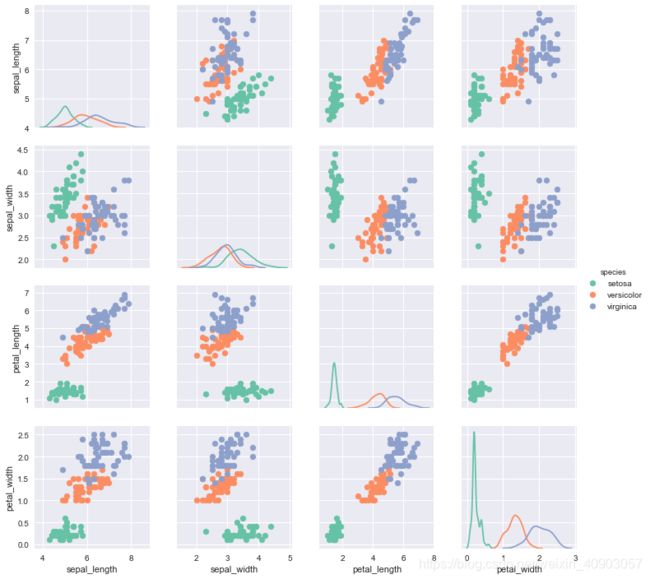
sns.pairplot(iris, hue="species", palette="Set2", diag_kind="kde", size=2.5);
[外链图片转存失败(img-IjJmOjw9-1562742948670)(output_48_0.png)]
# 选定指定变量进行画图
g = sns.PairGrid(iris, vars=["sepal_length", "sepal_width"], hue="species")
g.map(plt.scatter);
[外链图片转存失败(img-AvrCqOAl-1562742948671)(output_49_0.png)]

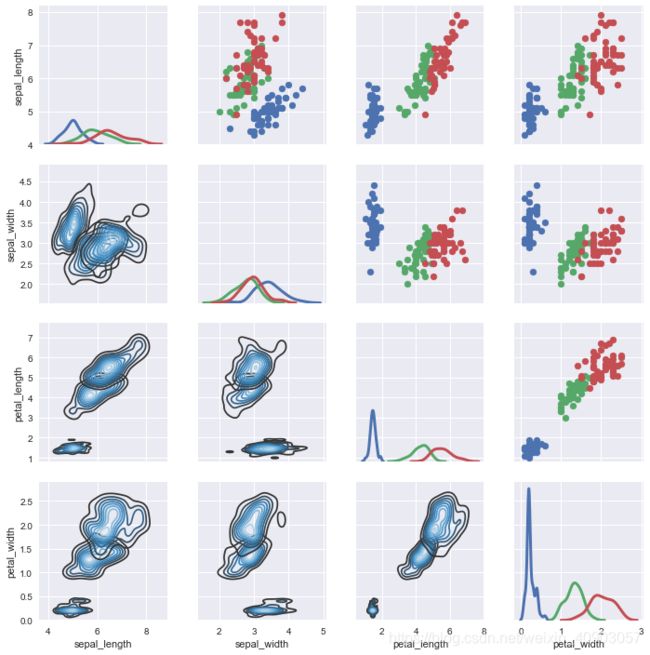
g = sns.PairGrid(iris,hue="species",)
g.map_upper(plt.scatter)
g.map_lower(sns.kdeplot, cmap="Blues_d")
g.map_diag(sns.kdeplot, lw=3, legend=False);
