python:使用机器学习算法对卫星遥感影像进行分类
之前写过一篇使用R语言对卫星影像进行kmeans聚类的文章,本文来个python版本的。
Python版的没有R语言版本的简单(代码多了一些),但是通过Python版的学习可以清楚了解到对卫星影像进行分类的整个流程。因为Python在机器学习/深度学习方面比较通用,学会了本文之后,就学会了任何基于机器学习对卫星影像进行分类的流程,只需要换下中间的分类算法即可。
公众号《GIS与Climate》,分享R、Python、GIS和Climate的相关技术,求关注。
导入需要的包
因为本文用的是kmeans算法,也没什么高大上的,需要的包也就比较少:
import rasterio as rio
from rasterio.plot import show
from sklearn import cluster
import matplotlib.pyplot as plt
import numpy as np
import matplotlib.colors as mc
读取数据
我们用rasterio包来读取栅格数据(这里以tif格式作为示例):
rs = rio.open('./landsat8/LC81970242014109LGN00.tif')
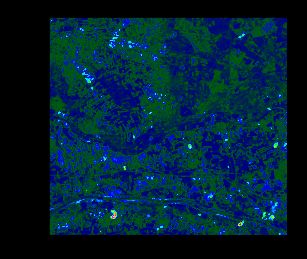
可视化一下:
rs_data = rs.read()
vmin, vmax = np.nanpercentile(rs_data, (2, 98))
plt.figure()
show(rs, vmin=vmin, vmax=vmax,cmap="gist_ncar")
plt.show()

- 直接使用rasterio包的show函数也可以,但是按照上面的三个步骤更有助于养成使用matplotlib的基本习惯;
- 上面对数据可视化的时候进行了线性拉伸,可以自行调整(避免图像很亮或者很暗);
数据预处理
原数据读取之后是numpy.ndarray格式的,其shape不符合我们一般进行机器学习的要求,所以要先reshape成我们需要的数据。在这之前,我们先transpose一下,方便后面进行reshape:
rs_data_trans = rs_data.transpose(1,2,0)
rs_data.shape, rs_data_trans.shape
>> ((7, 694, 757), (694, 757, 7))
这样子我们就把波段放在了最后一个维度,然后直接把矩阵reshape成机器学习中常用的表格形状:
rs_data_1d = rs_data_trans.reshape(-1, rs_data_trans.shape[2])
rs_data_1d.shape
>> (525358, 7)
- 上面的其实就可以理解为我们平时读取csv之后的形状,每一行代表一个记录(这里就是一个像元),每一列代表一个特征(这里就是各个波段的像元值);
- 因为kmeans是非监督学习,所以没有label,如果用其他算法,把label进行相同的处理即可;
建立模型
然后我们用sklearn建立模型:
cl = cluster.KMeans(n_clusters=4) # create an object of the classifier
param = cl.fit(rs_data_1d) # train it
获取结果
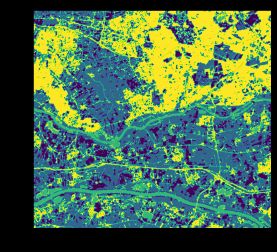
在获取了模型的分类结果之后,我们把它的形状重新还原成与原始影像相同的(只不过只有一个波段),方便后面保存为tif数据:
img_cl = cl.labels_
img_cl = img_cl.reshape(rs_data_trans[:,:,0].shape)
 聚类结果
聚类结果
保存结果
然后把矩阵保存为tif格式的结果,方便进行出图:
prof = rs.profile
prof.update(count=1)
with rio.open('result.tif','w',**prof) as dst:
    dst.write(img_cl, 1)
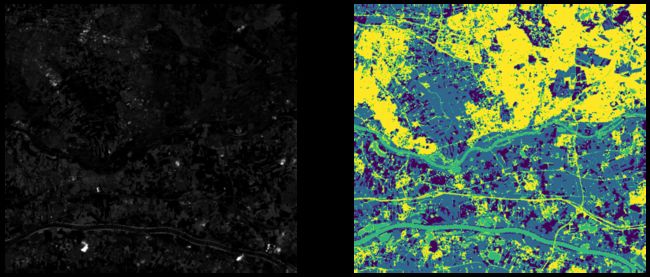
分类前后对比
进行可视化查看分类前后的数据:
fig, (ax1,ax2) = plt.subplots(figsize=[15,15], nrows=1,ncols=2)
show(rs, cmap='gray', vmin=vmin, vmax=vmax, ax=ax1)
show(img_cl, ax=ax2)
ax1.set_axis_off()
ax2.set_axis_off()
fig.savefig("pred.png", bbox_inches='tight')
plt.show()
 分类结果
分类结果
总结
按照上面的流程,我们很容易就可以使用一个机器学习方法对影响进行分类,只不过上面使用的是非监督分类,如果有样点数据的话,可以用监督分类的方法进行,只需要更换中间的模型部分即可,是不是so easy!
公众号《GIS与Climate》,分享R、Python、GIS和Climate的相关技术。

参考
【1】https://scikit-learn.org.cn/
【2】https://towardsdatascience.com/sentinel-2-image-clustering-in-python-58f7f2c8a7f6
本文由 mdnice 多平台发布