自动驾驶中常用曲线拟合方法
系列文章目录
文章目录
- 系列文章目录
- 前言
- 一、常用拟合方法
-
- 1. 线性拟合
- 2.多项式拟合(二次)
- 3.多项式拟合(三次)
- 4.指数拟合
- 5.高斯拟合
- 二、代码实现
前言
在自动驾驶项目中,经常涉及到一些曲线拟合的工作,现在想整理一下这些基础的方法。
一、常用拟合方法
1. 线性拟合
def f_1(self, x, A, B):
    return A * x + B
2.多项式拟合(二次)
def f_2(self, x, A, B, C):
    return A * x * x + B * x + C
3.多项式拟合(三次)
def f_3(self, x, A, B, C, D):
    return A * x * x * x + B * x * x + C * x + D
4.指数拟合
def f_ln(self, x, A, B):
    return A * np.log(x) + B
5.高斯拟合
def f_ln(self, x, A, B):
    return A * np.log(x) + B
二、代码实现
在这里为了方便拟合的运算,我们使用了SCIPY的包用于拟合曲线,后续别的同学也可以利用这个包进行别的函数的拟合。
import numpy as np
from scipy import optimize
然后就是定义调用函数了,为了方便后续的使用,我们定义函数Fitting。
    def Fitting(self, model="line"):

        info = []

        if model is "line":
            A1, B1 = optimize.curve_fit(self.f_1, self.x_0, self.y_0)[0]
            info = [A1, B1]
            y_1 = A1 * self.x_1 + B1

        elif model is "square":
            A1, B1, C1 = optimize.curve_fit(self.f_2, self.x_0, self.y_0)[0]
            info = [A1, B1, C1]
            y_1 = A1 * self.x_1 * self.x_1 + B1*self.x_1 + C1

        elif model is "cube":
            A1, B1, C1, D1 = optimize.curve_fit(self.f_3, self.x_0, self.y_0)[0]
            info = [A1, B1, C1, D1]
            y_1 = A1 * self.x_1 * self.x_1 * self.x_1 + B1 * self.x_1 * self.x_1 + C1* self.x_1 + D1

        elif model is "gauss":
            A1, B1, C1, sigma = optimize.curve_fit(self.f_gauss, self.x_0, self.y_0)[0]
            info = [A1, B1, C1, sigma]
            y_1 = A1 * np.exp(-(self.x_1 - B1) ** 2 / (2 * sigma ** 2)) + C1

        elif model is "ln":
            A1, B1 = optimize.curve_fit(self.f_ln, self.x_0, self.y_0)[0]
            info = [A1, B1]
            y_1 = A1 * np.log(self.x_1) + B1

        return y_1, info
最后,完成了函数的定义准备工作以后我们来看一下我们这几种曲线的拟合方法最后的结果吧!
import cruveFitting
import numpy as np
import matplotlib.pyplot as plt

plt.figure()

x0 = [1, 2, 3, 4, 5]
y0 = [1, 3, 8, 18, 36]
x1 = np.arange(1, 6, 0.01)
plt.scatter(x0[:], y0[:], 25, "red")

Fitting = cruveFitting.CruveFitting(x0, y0, x1)

y_line, parameters_line = Fitting.Fitting(model="line")
y_square, parameters_square = Fitting.Fitting(model="square")
y_cube, parameters_cube = Fitting.Fitting(model="cube")
y_gauss, parameters_gauss = Fitting.Fitting(model="gauss")
y_ln, parameters_ln = Fitting.Fitting(model="ln")

plt.plot(x1, y_line, "blue")
plt.plot(x1, y_square, "yellow")
plt.plot(x1, y_cube, "green")
plt.plot(x1, y_gauss, "orange")
plt.plot(x1, y_ln, "gray")

plt.title("test")
plt.xlabel('x')
plt.ylabel('y')

plt.show()
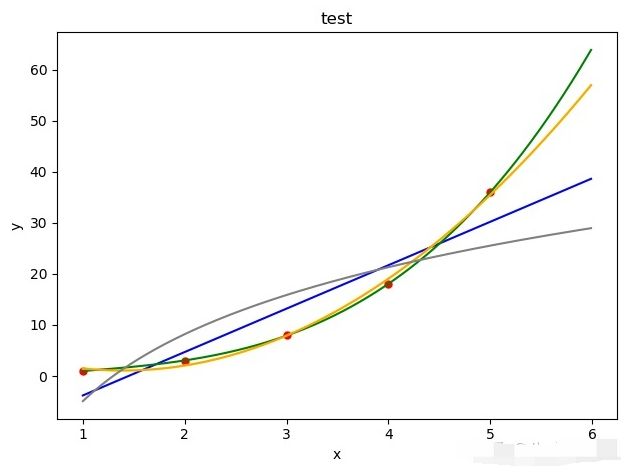
其中,蓝色是线性拟合,淡黄色是多项式(二次)拟合,绿色是多项式(三次)拟合,橘黄色是高斯拟合,灰色是对数拟合。

拟合方法是一种可以很好的查看出数据趋势的一种方法,同样也可以用在数据近似,差值等方法中。