Python数据分析及可视化之Seaborn可视化
导入第三方包时,先安装一下pip,再安装第三方包
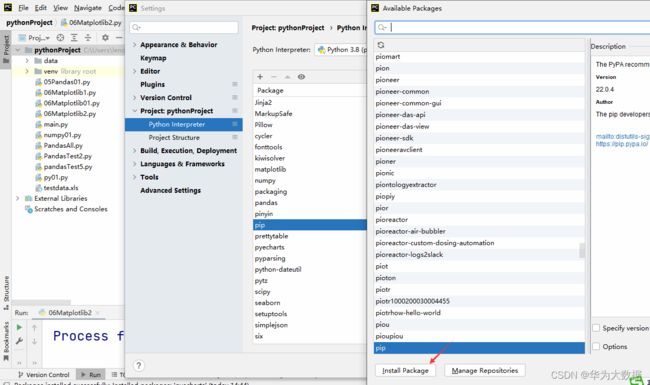
安装第三方包seaborn

Seaborn属于Matplotlib的一个高级接口,使得作图更加容易。在多数情况下使用Seaborn能做出很具吸引力的图,而使用Matplotlib可以制作具有更多特色的图。应该把Seaborn视为Matplotlib的补充,而不是替代物。
使用Seaborn时,使用的导入惯例为:
import seaborn as sns
一、风格设置
风格设置用以设置绘图的背景色、风格、字型、字体等。
Seaborn通过set函数实现风格设置:例如
seaborn.set(context='notebook', style='darkgrid', palette='deep', font='sans-serif', font_scale=1, color_codes=True, rc=None)
1、Seaborn的绘图设置 set
1.1、导入模块
import seaborn as sns
import numpy as np
import matplotlib.pyplot as plt
1.2 Seaborn设置风络曲线
def sinplot(flip=2):
x = np.linspace(0,20,50)
for i in range(1,5):
plt.plot(x,np.cos(x+i*0.8)*(9-2*i)*flip)
plt.show()
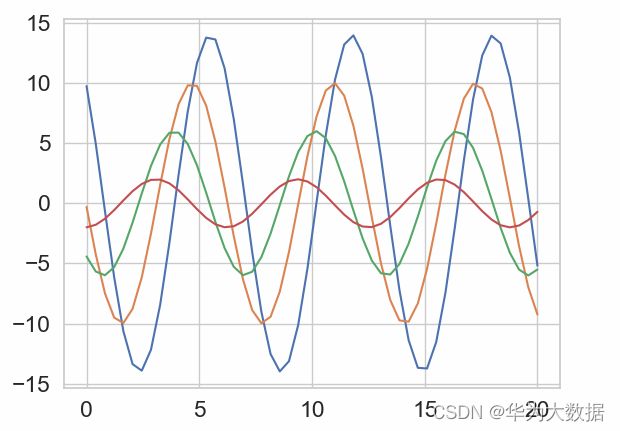
sns.set(style='darkgrid',font_scale=1.5)
sinplot()输出结果:

1.3 注:如果需要转换为seaborn默认的绘图设置,只需调用sns.set( )方法即可
def sinplot(flip=2):
    x = np.linspace(0,20,50)
    for i in range(1,5):
        plt.plot(x,np.cos(x+i*0.8)*(9-2*i)*flip)
    plt.show()
sns.set()
sinplot()
2、Seaborn主题设置
2.1 利用set_style( )是用来设置主题的。
Seaborn有五个预设好的主题: darkgrid, whitegrid,dark,white,和 ticks,默认为darkgrid。
def sinplot(flip=2):
    x = np.linspace(0,20,50)
    for i in range(1,5):
        plt.plot(x,np.cos(x+i*0.8)*(9-2*i)*flip)
    plt.show()
sns.set(style='darkgrid',font_scale=1.5)
#sns.set()
sns.set_style('whitegrid')
sinplot()
输出结果:
2.2 Seaborn的轴线设置
(1)despine() 移除绘图中顶部和右侧的轴线
def sinplot(flip=2):
    x = np.linspace(0,20,50)
    for i in range(1,5):
        plt.plot(x,np.cos(x+i*0.8)*(9-2*i)*flip)
    sns.despine()
    plt.show()
输出结果:

(2)当刻度没有完全覆盖整个坐标轴时,使用trim修剪刻度
sns.despine(offset=20,trim=True)
(3)移除左边轴线
sns.despine(left=True)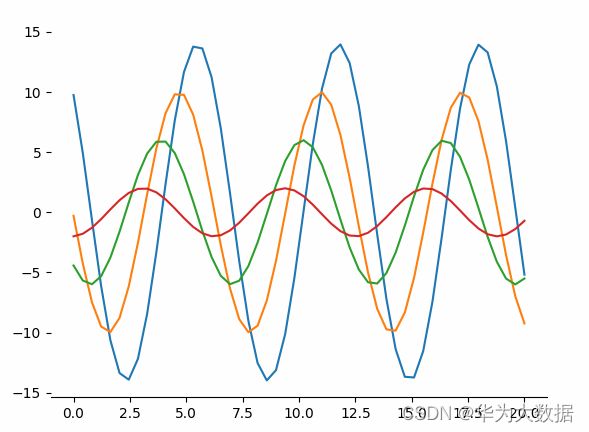
(4)移除左边及底部轴线
sns.despine(left=True,bottom=True)
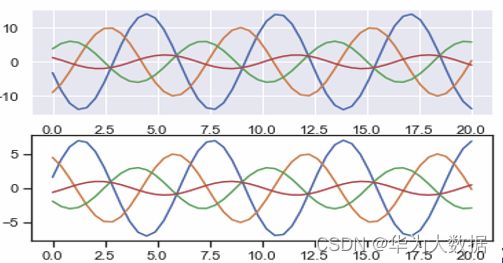
(5)with语句,设置临时绘图参数
with sns.axes_style('darkgrid'):
    plt.subplot(2,1,1)
    sinplot()
plt.subplot(2,1,2)
sinplot(-1)
输出结果:(上课时在两个图上显示的)
(6)使用字典传递参数
sns.set_style('darkgrid',{'axes.facecolor':'.9'})