sagemath matlab,开源跨平台数学软件SageMath v8.1
SageMath 是一个免费的、开源的数学软件系统,采用GPL协议。它整合了许多开源Python包,采用Python语言编写,但也支持其他语言。它的目标是创造一个可变的开源软件以替代Magma、Maple、Mathematica和Matlab。Sage不仅是一个软件,也是一个编程环境,提供命令行模式、笔记本模式,可以编写编译型程序和解释型程序。目前Sage支持Linux、Mac OS X、BSD、Solaris平台。
Sage程序较大(1G+),但是提供了网络接口,就是说,用户可以在不安装整个程序的情况下,在服务器上运行Sage的笔记本模式。可以通过扩展阅读中提供的地址注册账号免费试用。也可以在自己的服务器上架设Sage。使用时,可以随时点击右上角的Help获取帮助。对于使用Sage基本功能的四则运算、微积分、线性代数、数论图论等,网络版Notebook完全可以应付。如果需要3D作图,需要浏览器支持Java。
Notebook模式被翻译为了笔记本模式,觉得甚不妥。确切的说,notebook模式即使在浏览器里面写代码,运行代码,输出结果等,将浏览器作为了一个IDE。sage是华盛顿大学联合一百多位数学家开发的,将许多开源的科学计算软件和类库同一开发一个Python接口,使用Python进行科学计算。功能非常强大,完全可以超越MATLAB!
SageMath is a free open-source mathematics software system licensed under the GPL. It builds on top of many existing open-source packages: NumPy, SciPy, matplotlib, Sympy, Maxima, GAP, FLINT, R and many more. Access their combined power through a common, Python-based language or directly via interfaces or wrappers.
Mission: Creating a viable free open source alternative to Magma, Maple, Mathematica and Matlab.
SageMath Feature Tour
SageMath is built out of nearly 100 open-source packages and features a unified interface. SageMath can be used to study elementary and advanced, pure and applied mathematics. This includes a huge range of mathematics, including basic algebra, calculus, elementary to very advanced number theory, cryptography, numerical computation, commutative algebra, group theory, combinatorics, graph theory, exact linear algebra and much more. It combines various software packages and seamlessly integrates their functionality into a common experience. It is well-suited for education and research.
The user interface is a notebook in a web browser or the command line. Using the notebook, SageMath connects either locally to your own SageMath installation or to a SageMath server on the network. Inside the SageMath notebook you can create embedded graphics, beautifully typeset mathematical expressions, add and delete input, and share your work across the network.
The following showcase presents some of SageMath’s capabilities, screenshots and gives you an overall impression of what SageMath is. The examples show the lines of code in SageMath on the left side, accompanied by an explanation on the right. They only show the very basic concepts of how SageMath works. Please refer to the documentation material for more detailed explanations or visit the library to see SageMath in action.
Video Introduction to SageMath by William Stein — first video of several explaining SageMath, better than a bunch of screenshots…
Quickstart with SageMath — explains basic concepts and gives you an impression of what SageMath is.
SageMath Graphics — shows examples of useful plots and visualizations.
SageMath in Research — presents features useful for higher mathematics.
SageMath Benchmarks — compares speed or memory usage of SageMath with other systems.
Documentation: A Guided Tour
The interactive Shell
Basic Algebra and Calculus
Plotting, 2D and 3D
Basic Rings
Univariate and Multivariate Polynomials
Linear Algebra (Vector, Matrix, …)
Finite Groups
Advanced Mathematics in SageMath
More about SageMath
Testimonials, Success Stories and News — read what others write about SageMath.
Screenshots — they give an impression how a SageMath notebook looks like.
Pictures — collection of images drawn by SageMath.
Interact — examples of SageMath’s interactive drawing capabilities.
sage: def f(x):
....: return RDF(1 / (1 + 25 * x^2))
....:
sage: def runge():
....: g = plot(f, -1, 1, rgbcolor='red', thickness=1)
....: polynom = []
....: for i, n in enumerate([6, 8, 10, 12]):
....: data = [(x, f(x)) for x in xsrange(-1, 1, 2 / (n - 1), ...
include_endpoint=True)]
....: polynom.append(maxima.lagrange(data).sage())
....: g += list_plot(data, rgbcolor='black', pointsize=5)
....: g += plot(polynom, -1, 1, fill=f, fillalpha=0.2, thickness=0)
....: return g
....:
sage: runge().show(ymin=0, ymax=1, figsize=(6,4))
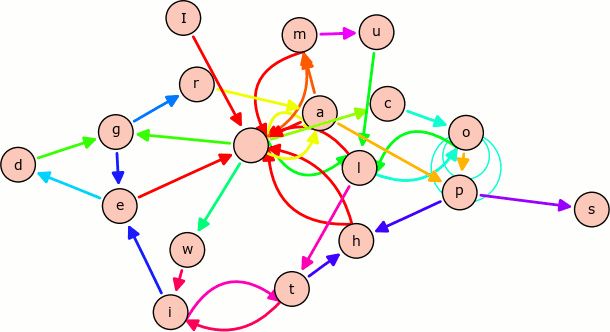
sage: stnc = 'I am a cool multiedge graph with loops'
sage: g = DiGraph({}, loops=True, multiedges=True)
sage: for a,b in [(stnc[i], stnc[i+1]) for i in xrange(len(stnc)-1)]:
....: g.add_edge(a, b, b)
sage: g.plot(color_by_label=True, edge_style='solid').show(figsize=(8,8))
下载地址
SageMath中文文档(By amao):
石墨直链PDF:https://attachments-cdn.shimo.im/O736zlvCm9I4XiCW/SageTutorial.pdf
石墨直链HTML:https://attachments-cdn.shimo.im/FCyltpSHxlAwlOGF/html_tutorial.zip
石墨直链RST:https://attachments-cdn.shimo.im/t2K7irrpwWoNyZey/rst_tutorial.zip
百度网盘:https://pan.baidu.com/s/1nwPRKLj


