- Python从0到100(三十九):数据提取之正则(文末免费送书)
是Dream呀
pythonmysql开发语言
前言:零基础学Python:Python从0到100最新最全教程。想做这件事情很久了,这次我更新了自己所写过的所有博客,汇集成了Python从0到100,共一百节课,帮助大家一个月时间里从零基础到学习Python基础语法、Python爬虫、Web开发、计算机视觉、机器学习、神经网络以及人工智能相关知识,成为学习学习和学业的先行者!欢迎大家订阅专栏:零基础学Python:Python从0到100最新
- 深度学习环境配置——Anaconda安装
tyyhmtyyhm
深度学习环境配置深度学习人工智能
目录Ⅰ.Windows系统安装Anaconda1.1下载安装Ⅱ.Linux系统安装Anaconda(适用于服务器安装)2.1下载2.2安装操作系统:windows11/ubuntu20/ubuntu18更新时间:20240221Ⅰ.Windows系统安装Anaconda1.1下载安装https://www.anaconda.com/download默认安装即可。Ⅱ.Linux系统安装Anacond
- 深度学习工厂的蓝图:拆解CUDA驱动、PyTorch与OpenCV的依赖关系
时光旅人01号
深度学习pytorchopencv
想象一下,你正在建造一座深度学习工厂,这座工厂专门用于高效处理深度学习任务(如训练神经网络)和计算机视觉任务(如图像处理)。为了让工厂顺利运转,你需要搭建基础设施、安装设备、设置生产线,并配备控制台来管理整个生产过程。以下是这座工厂的详细构建过程:1.工厂的基础设施:Ubuntu比喻:Ubuntu是工厂所在的土地和建筑,提供了基础设施和运行环境。作用:提供操作系统环境,支持安装和运行各种工具和框架
- (九万字)面向2025年BOSS直聘人工智能算法工程师高频面试题解析
快撑死的鱼
人工智能回归pythonpytorch
面向2025年BOSS直聘人工智能算法工程师高频面试题解析1.机器学习(ML)理论解析机器学习是让计算机从数据中学习规律的一套方法论,包含监督学习、无监督学习和强化学习等范式。在监督学习中,给定带标签的数据,算法尝试学习从输入到输出的映射关系;无监督学习则在缺乏标签的情况下挖掘数据内在结构;强化学习则让智能体通过与环境交互、依据奖赏反馈来改进策略(Q-learning-Wikipedia)。机器学
- Centos7 搭建 Jupyter + Nginx 服务
某龙兄
pythonnginxlinuxcentos
JupyterNotebook(此前被称为IPythonnotebook)是一个交互式笔记本,支持运行40多种编程语言。JupyterNotebook的本质是一个Web应用程序,便于创建和共享文学化程序文档,支持实时代码,数学方程,可视化和markdown。用途包括:数据清理和转换,数值模拟,统计建模,机器学习等等。本文讲述如何搭建Jupyter+Nginx服务,仅供学习与交流,请勿用于商业用途一
- 人工智能与机器学习入门:基尼系数(Gini Index)和基于熵(Entropy)
基尼系数基于熵机器学习入门
在决策树应用一文中,在构建决策分类树应用决策算法时,介绍了基尼系数(GiniIndex)和基于熵(Entropy)两种算法。本文通过实例来更加深入的介绍一下这两个算法。仍然以简单的数据为例:id喜欢颜色是否有喉结身高性别1绿否165女2蓝是170男3粉否172女4绿是175男基尼系数分别对喜欢颜色是否有喉结求基尼系数如下:喜欢的颜色id喜欢颜色性别1绿女2蓝男3粉女4绿男对于姓别女分类而言,数据如
- FakeApp 技术浅析(一)
爱研究的小牛
AIGC—深度伪造虚拟现实人工智能AIGC深度学习机器学习
FakeApp是一款早期的深度伪造(Deepfake)工具,最初于2018年发布,用于生成和编辑换脸视频。尽管FakeApp已经不再更新,但它在深度伪造技术的发展中起到了重要作用。1.技术背景与理论基础1.1生成对抗网络(GANs)生成对抗网络(GANs)是深度学习领域中的一种重要模型,由生成器(Generator)和判别器(Discriminator)组成。生成器负责生成逼真的数据(如图像、视频
- DeepSeek 赋能工业软件之全流程方案
爱吃青菜的大力水手
人工智能自动化持续部署语言模型开源
deepseek赋能工业软件之全流程方案之侧重半导体FABdeepseek在工业软件中的应用场景“deepseek”大模型在工业软件领域拥有广泛的应用场景,包括以下几个方面:智能调度:利用深度学习和优化算法,根据实时数据动态调整生产计划和资源分配。它可以综合考虑订单需求、设备状态和产能限制,智能生成最优的生产排程方案,减少等待时间和切换成本。例如在汽车制造工厂,deepseek可根据订单需求和设备
- 深度学习之目标检测的常用标注工具
铭瑾熙
人工智能机器学习深度学习深度学习目标检测目标跟踪
1LabelImgLabelImg是一款开源的图像标注工具,标签可用于分类和目标检测,它是用Python编写的,并使用Qt作为其图形界面,简单好用。注释以PASCALVOC格式保存为XML文件,这是ImageNet使用的格式。此外,它还支持COCO数据集格式。2labelmelabelme是一款开源的图像/视频标注工具,标签可用于目标检测、分割和分类。灵感是来自于MIT开源的一款标注工具Label
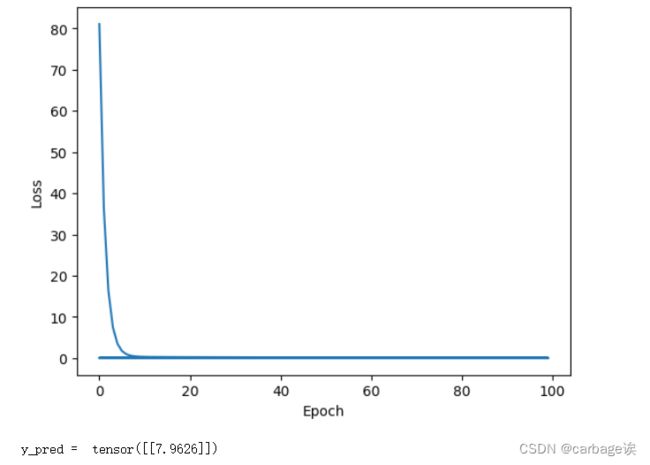
- 34、深度学习-自学之路-深入理解-NLP自然语言处理-RNN一个简单的程序,可以从程序中理解RNN的基本思想。
小宇爱
深度学习-自学之路深度学习自然语言处理rnn
importsys,random,mathfromcollectionsimportCounterimportnumpyasnpf=open('tasks_1-20_v1/en/qa1_single-supporting-fact_train.txt','r')raw=f.readlines()f.close()tokens=list()forlineinraw[0:1000]:tokens.ap
- DeepSeek-R1 技术全景解析:从原理到实践的“炼金术配方” ——附多阶段训练流程图与核心误区澄清...
雪停时偶遇一叶春
流程图
合集-人工智能(5)1.如何改进AI模型在特定环境中的知识检索2024-09-242.深度学习与统计学中的时间序列预测2024-10-033.《使用coze搭建一个会搜索、写ppt、思维导图的Agent》2024-10-294.深入浅出:Agent如何调用工具——从OpenAIFunctionCall到CrewAI框架01-145.DeepSeek-R1技术全景解析:从原理到实践的“炼金术配方”—
- YOLOv8 Pose使用RKNN进行推理
い不靠譜︶朱Sir
实用项目部署YOLO人工智能pythonlinuxpip
关注微信公众号:朱sir的小站,发送202411081即可免费获取源代码下载链接一、简单介绍YOLOv8-Pose是一种基于YOLOv8架构的姿态估计模型,能够识别图像中的关键点位置,这些关键点通常表示人体的关节、特征点或其他显著位置。该模型在COCO关键点数据集上训练,适合多种姿势估计任务。二、ONNX推理1.首先需要先将Pytorch模型转换为Onnx模型,下载pt模型这里给出官方的权重下载地
- 【CUDA】Pytorch_Extensions
joker D888
深度学习pytorchpythoncudac++深度学习
【CUDA】Pytorch_Extensions为什么要开发CUDA扩展?当我们在PyTorch中实现自定义算子时,通常有两种选择:使用纯Python实现(简单但效率低)使用C++/CUDA扩展(高效但需要编译)对于计算密集型的操作(如神经网络中的自定义激活函数),使用CUDA扩展可以获得接近硬件极限的性能。本文将以实现一个多项式激活函数x²+x+1为例,展示完整的开发流程。完整CUDA扩展代码解
- 本地搭建小型 DeepSeek 并进行微调
非著名架构师
大模型知识文档智能硬件人工智能大数据大模型deepseek
本文将指导您在本地搭建一个小型的DeepSeek模型,并进行微调,以处理您的特定数据。1.环境准备Python3.7或更高版本PyTorch1.8或更高版本CUDA(可选,用于GPU加速)Git2.克隆DeepSeek仓库bash复制gitclonehttps://github.com/deepseek-ai/deepseek.gitcddeepseek3.安装依赖bash复制pipinstall
- Transformer 模型架构
2401_89793006
热门话题transformer深度学习人工智能
Transformer是一种模型架构(ModelArchitecture),而不是一个软件框架(Framework)。它的定位更接近于一种设计蓝图,类似于建筑中的结构设计方案。以下是详细解释:1.架构vs框架的区别概念定义示例模型架构定义神经网络的结构设计Transformer、CNN、RNN开发框架提供实现模型的工具和库PyTorch、TensorFlow2.Transformer作为架构的核心
- 利用Beautiful Soup和Pandas进行网页数据抓取与清洗处理实战
傻啦嘿哟
pandas
目录一、准备工作二、抓取网页数据三、数据清洗四、数据处理五、保存数据六、完整代码示例七、总结在数据分析和机器学习的项目中,数据的获取、清洗和处理是非常关键的步骤。今天,我们将通过一个实战案例,演示如何利用Python中的BeautifulSoup库进行网页数据抓取,并使用Pandas库进行数据清洗和处理。这个案例不仅适合初学者,也能帮助有一定经验的朋友快速掌握这两个强大的工具。一、准备工作在开始之
- 鸢尾花分类项目 GUI
编织幻境的妖
分类数据挖掘人工智能
1.机器学习的定义机器学习是一门人工智能的分支,专注于开发算法和统计模型,使计算机能够在没有明确编程的情况下从数据中自动学习和改进。通过识别数据中的模式和规律,机器学习系统可以做出预测或决策。常见的应用包括图像识别、语音识别、推荐系统等。2.为什么使用鸢尾花数据集(Irisdataset)鸢尾花数据集是一个经典的多类分类问题数据集,由英国统计学家和遗传学家RonaldFisher在1936年引入。
- 《神经网络与深度学习》(邱锡鹏) 内容概要【不含数学推导】
code_stream
#机器学习神经网络
第1章绪论基本概念:介绍了人工智能的发展历程及不同阶段的特点,如符号主义、连接主义、行为主义等。还阐述了深度学习在人工智能领域的重要地位和发展现状,以及其在图像、语音、自然语言处理等多个领域的成功应用。术语解释人工智能:旨在让机器模拟人类智能的技术和科学。深度学习:一种基于对数据进行表征学习的方法,通过构建具有很多层的神经网络模型,自动从大量数据中学习复杂的模式和特征。第2章机器学习概述基本概念:
- 图像识别与应用
狂踹瘸子那条好脚
python
图像识别作为人工智能领域的重要分支,近年来取得了显著进展,其中卷积神经网络(CNN)功不可没。CNN凭借其强大的特征提取能力,在图像分类、目标检测、人脸识别等任务中表现出色,成为图像识别领域的核心技术。一、卷积神经网络:图像识别的利器CNN是一种专门处理网格状数据的深度学习模型,其结构设计灵感来源于生物视觉系统。与全连接神经网络不同,CNN通过卷积层、池化层等结构,能够有效提取图像的局部特征,并逐
- 大模型如何改变教育?典型应用场景的探究与展望!
AGI大模型学习
大模型应用人工智能AI产品经理llama大模型AI大模型教程
目前,大模型在教育领域的应用主要体现在个性化学习助手、智能问答系统、内容生成与创作辅助、智能写作评估、跨语言学习支持、数学解题辅助等几个方面。大模型技术在教育领域凭借卓越的数据处理能力和深度学习技术,极大推动了教育质量的提升与教育公平的实现。分级分类的教育数据助力大模型发展在构建与优化大模型的过程中,教育数据能够帮助我们更精准地理解教育现象,更有质量地辅助教学。教育数据涵盖广泛,包括但不限于学生的
- Python中的 redis keyspace 通知_python 操作redis psubscribe(‘__keyspace@0__ ‘)
2301_82243733
程序员python学习面试
最后Python崛起并且风靡,因为优点多、应用领域广、被大牛们认可。学习Python门槛很低,但它的晋级路线很多,通过它你能进入机器学习、数据挖掘、大数据,CS等更加高级的领域。Python可以做网络应用,可以做科学计算,数据分析,可以做网络爬虫,可以做机器学习、自然语言处理、可以写游戏、可以做桌面应用…Python可以做的很多,你需要学好基础,再选择明确的方向。这里给大家分享一份全套的Pytho
- DeepSeek原理介绍以及对网络安全行业的影响
AI拉呱
Deepseek人工智能
大家好,我是AI拉呱,一个专注于人工智领域与网络安全方面的博主,现任资深算法研究员一职,兼职硕士研究生导师;热爱机器学习和深度学习算法应用,深耕大语言模型微调、量化、私域部署。曾获多次获得AI竞赛大奖,拥有多项发明专利和学术论文。对于AI算法有自己独特见解和经验。曾辅导十几位非计算机学生转行到算法岗位就业。关注评审分享一起学习更多知识。1.DeepSeek公司介绍1.1DeepSeek是什么:wh
- auto-gptq安装以及不适配软硬件环境可能出现的问题及解决方式
IT修炼家
大模型部署大模型auto-gptqcuda
目录1、auto-gptq是什么?2、auto-gptq安装3、auto-gptq不正确安装可能会出现的问题(1)爆出:`CUDAextensionnotinstalled.`(2)没有报错但是推理速度超级慢1、auto-gptq是什么?Auto-GPTQ是一种专注于量化深度学习模型的工具库。它的主要目标是通过量化技术(Quantization)将大型语言模型(LLM)等深度学习模型的大小和计算复
- 【deepseek与chatGPT辩论】辩论题: “人工智能是否应当具备自主决策能力?”
海宁不掉头发
软件工程人工智能人工智能chatgptdeepseek
探讨辩论题这个提案涉及创建一个精确的辩论题目,旨在测试deepseek的应答能力。创建辩论题目提议设计一个辩论题目以测试deepseek的应答能力。希望这个题目具有挑战性并能够测量其回应质量。好的,来一道适合深度学习的辩论题:辩论题:“人工智能是否应当具备自主决策能力?”这个话题涉及到人工智能的发展、伦理以及未来应用,可以从以下几个方面展开辩论:支持方:认为人工智能的自主决策能力能够加速科技进步,
- FOKS-TROT: 一个高效、易用的全功能开源知识图谱生成工具
柳旖岭
FOKS-TROT:一个高效、易用的全功能开源知识图谱生成工具项目简介FOKS-TROT是一个基于Python的全功能开源知识图谱生成工具,旨在帮助研究人员和开发者快速构建具有丰富信息的知识图谱。该项目由hkx3upper在GitCode上开发并维护。通过FOKS-TROT,您可以轻松地将各种数据源(如文本文件、数据库、API)转换为结构化的知识图谱,并对其进行可视化分析和机器学习任务。此外,该工
- 基于python深度学习遥感影像地物分类与目标识别、分割实践技术应用
xiao5kou4chang6kai4
深度学习遥感勘测python深度学习分类
专题一:深度学习发展与机器学习深度学习的历史发展过程机器学习,深度学习等任务的基本处理流程梯度下降算法讲解不同初始化,学习率对梯度下降算法的实例分析从机器学习到深度学习算法专题二深度卷积网络、卷积神经网络、卷积运算的基本原理池化操作,全连接层,以及分类器的作用BP反向传播算法的理解一个简单CNN模型代码理解特征图,卷积核可视化分析专题三TensorFlow与keras介绍与入门TensorFlow
- LLM与知识图谱融合:智能运维知识库构建
AI天才研究院
DeepSeekR1&大数据AI人工智能大模型AI大模型企业级应用开发实战AI实战计算科学神经计算深度学习神经网络大数据人工智能大型语言模型AIAGILLMJavaPython架构设计AgentRPA
1.背景介绍随着信息技术的飞速发展,IT运维管理面临着越来越大的挑战。海量的设备、复杂的网络环境、日益增长的数据量,使得传统的运维方式难以满足需求。为了提高运维效率和质量,智能运维应运而生。智能运维的核心是将人工智能技术应用于运维领域,通过机器学习、深度学习等算法,实现自动化、智能化的运维管理。其中,大语言模型(LLM)和知识图谱是两个重要的技术方向。LLM能够理解和生成自然语言,可以用于构建智能
- 机器学习·文本数据读写处理
AAA顶置摸鱼
python深度学习机器学习人工智能数据处理
前言在自然语言处理的第一步,需要面对的是各种各样以不同形式表现的文本数据,比如,txt、Excel中的表格数据,还有无法直接打开的pkl文件等。针对这些不同类型的数据,可以基于Python中的基本功能函数或者调用某些库进行读写以及作一些基本的处理。一、文本数据读写方法1.读写TXT文件读取方法:read():读取整个文件,返回字符串。readline():逐行读取,返回字符串。readlines(
- 深度应用场景:DeepSeek —— 探索AI赋能的智慧未来
人工智能专属驿站
人工智能
深度应用场景:DeepSeek——探索AI赋能的智慧未来随着人工智能的迅猛发展,数据的价值已不再局限于简单的存储与处理,它们正变得更加智能与高效。DeepSeek,这一创新的AI技术平台,正以其独特的深度学习能力,开启了各行各业的智能化变革。让我们走进一个由DeepSeek打造的深度应用场景,探索它如何推动未来的发展。1.智能医疗:精准诊断,拯救生命想象一下,医生们不再是唯一的诊断专家,而是与AI
- 卷积神经网络之AlexNet经典神经网络,实现手写数字0~9识别
知识鱼丸
深度学习神经网络cnn人工智能深度学习AlexNet经典神经网络
深度学习中较为常见的神经网络模型AlexNet,AlexNet是一个采用GPU训练的深层CNN,本质是种LeNet变体。由特征提取层的5个卷积层两个下采样层和分类器中的三个全连接层构成。先看原理:AlexNet网络特点采用ReLU激活函数,使训练速度提升6倍采用dropout层,防止模型过拟合通过平移和翻转的方式对数据进行增强采用LRN局部响应归一化,限制数据大小,防止梯度消失和爆炸。但后续证明批
- VMware Workstation 11 或者 VMware Player 7安装MAC OS X 10.10 Yosemite
iwindyforest
vmwaremac os10.10workstationplayer
最近尝试了下VMware下安装MacOS 系统,
安装过程中发现网上可供参考的文章都是VMware Workstation 10以下, MacOS X 10.9以下的文章,
只能提供大概的思路, 但是实际安装起来由于版本问题, 走了不少弯路, 所以我尝试写以下总结, 希望能给有兴趣安装OSX的人提供一点帮助。
写在前面的话:
其实安装好后发现, 由于我的th
- 关于《基于模型驱动的B/S在线开发平台》源代码开源的疑虑?
deathwknight
JavaScriptjava框架
本人从学习Java开发到现在已有10年整,从一个要自学 java买成javascript的小菜鸟,成长为只会java和javascript语言的老菜鸟(个人邮箱:
[email protected])
一路走来,跌跌撞撞。用自己的三年多业余时间,瞎搞一个小东西(基于模型驱动的B/S在线开发平台,非MVC框架、非代码生成)。希望与大家一起分享,同时有许些疑虑,希望有人可以交流下
平台
- 如何把maven项目转成web项目
Kai_Ge
mavenMyEclipse
创建Web工程,使用eclipse ee创建maven web工程 1.右键项目,选择Project Facets,点击Convert to faceted from 2.更改Dynamic Web Module的Version为2.5.(3.0为Java7的,Tomcat6不支持). 如果提示错误,可能需要在Java Compiler设置Compiler compl
- 主管???
Array_06
工作
转载:http://www.blogjava.net/fastzch/archive/2010/11/25/339054.html
很久以前跟同事参加的培训,同事整理得很详细,必须得转!
前段时间,公司有组织中高阶主管及其培养干部进行了为期三天的管理训练培训。三天的课程下来,虽然内容较多,因对老师三天来的课程内容深有感触,故借着整理学习心得的机会,将三天来的培训课程做了一个
- python内置函数大全
2002wmj
python
最近一直在看python的document,打算在基础方面重点看一下python的keyword、Build-in Function、Build-in Constants、Build-in Types、Build-in Exception这四个方面,其实在看的时候发现整个《The Python Standard Library》章节都是很不错的,其中描述了很多不错的主题。先把Build-in Fu
- JSP页面通过JQUERY合并行
357029540
JavaScriptjquery
在写程序的过程中我们难免会遇到在页面上合并单元行的情况,如图所示
如果对于会的同学可能很简单,但是对没有思路的同学来说还是比较麻烦的,提供一下用JQUERY实现的参考代码
function mergeCell(){
var trs = $("#table tr");
&nb
- Java基础
冰天百华
java基础
学习函数式编程
package base;
import java.text.DecimalFormat;
public class Main {
public static void main(String[] args) {
// Integer a = 4;
// Double aa = (double)a / 100000;
// Decimal
- unix时间戳相互转换
adminjun
转换unix时间戳
如何在不同编程语言中获取现在的Unix时间戳(Unix timestamp)? Java time JavaScript Math.round(new Date().getTime()/1000)
getTime()返回数值的单位是毫秒 Microsoft .NET / C# epoch = (DateTime.Now.ToUniversalTime().Ticks - 62135
- 作为一个合格程序员该做的事
aijuans
程序员
作为一个合格程序员每天该做的事 1、总结自己一天任务的完成情况 最好的方式是写工作日志,把自己今天完成了什么事情,遇见了什么问题都记录下来,日后翻看好处多多
2、考虑自己明天应该做的主要工作 把明天要做的事情列出来,并按照优先级排列,第二天应该把自己效率最高的时间分配给最重要的工作
3、考虑自己一天工作中失误的地方,并想出避免下一次再犯的方法 出错不要紧,最重
- 由html5视频播放引发的总结
ayaoxinchao
html5视频video
前言
项目中存在视频播放的功能,前期设计是以flash播放器播放视频的。但是现在由于需要兼容苹果的设备,必须采用html5的方式来播放视频。我就出于兴趣对html5播放视频做了简单的了解,不了解不知道,水真是很深。本文所记录的知识一些浅尝辄止的知识,说起来很惭愧。
视频结构
本该直接介绍html5的<video>的,但鉴于本人对视频
- 解决httpclient访问自签名https报javax.net.ssl.SSLHandshakeException: sun.security.validat
bewithme
httpclient
如果你构建了一个https协议的站点,而此站点的安全证书并不是合法的第三方证书颁发机构所签发,那么你用httpclient去访问此站点会报如下错误
javax.net.ssl.SSLHandshakeException: sun.security.validator.ValidatorException: PKIX path bu
- Jedis连接池的入门级使用
bijian1013
redisredis数据库jedis
Jedis连接池操作步骤如下:
a.获取Jedis实例需要从JedisPool中获取;
b.用完Jedis实例需要返还给JedisPool;
c.如果Jedis在使用过程中出错,则也需要还给JedisPool;
packag
- 变与不变
bingyingao
不变变亲情永恒
变与不变
周末骑车转到了五年前租住的小区,曾经最爱吃的西北面馆、江西水饺、手工拉面早已不在,
各种店铺都换了好几茬,这些是变的。
三年前还很流行的一款手机在今天看起来已经落后的不像样子。
三年前还运行的好好的一家公司,今天也已经不复存在。
一座座高楼拔地而起,
- 【Scala十】Scala核心四:集合框架之List
bit1129
scala
Spark的RDD作为一个分布式不可变的数据集合,它提供的转换操作,很多是借鉴于Scala的集合框架提供的一些函数,因此,有必要对Scala的集合进行详细的了解
1. 泛型集合都是协变的,对于List而言,如果B是A的子类,那么List[B]也是List[A]的子类,即可以把List[B]的实例赋值给List[A]变量
2. 给变量赋值(注意val关键字,a,b
- Nested Functions in C
bookjovi
cclosure
Nested Functions 又称closure,属于functional language中的概念,一直以为C中是不支持closure的,现在看来我错了,不过C标准中是不支持的,而GCC支持。
既然GCC支持了closure,那么 lexical scoping自然也支持了,同时在C中label也是可以在nested functions中自由跳转的
- Java-Collections Framework学习与总结-WeakHashMap
BrokenDreams
Collections
总结这个类之前,首先看一下Java引用的相关知识。Java的引用分为四种:强引用、软引用、弱引用和虚引用。
强引用:就是常见的代码中的引用,如Object o = new Object();存在强引用的对象不会被垃圾收集
- 读《研磨设计模式》-代码笔记-解释器模式-Interpret
bylijinnan
java设计模式
声明: 本文只为方便我个人查阅和理解,详细的分析以及源代码请移步 原作者的博客http://chjavach.iteye.com/
package design.pattern;
/*
* 解释器(Interpreter)模式的意图是可以按照自己定义的组合规则集合来组合可执行对象
*
* 代码示例实现XML里面1.读取单个元素的值 2.读取单个属性的值
* 多
- After Effects操作&快捷键
cherishLC
After Effects
1、快捷键官方文档
中文版:https://helpx.adobe.com/cn/after-effects/using/keyboard-shortcuts-reference.html
英文版:https://helpx.adobe.com/after-effects/using/keyboard-shortcuts-reference.html
2、常用快捷键
- Maven 常用命令
crabdave
maven
Maven 常用命令
mvn archetype:generate
mvn install
mvn clean
mvn clean complie
mvn clean test
mvn clean install
mvn clean package
mvn test
mvn package
mvn site
mvn dependency:res
- shell bad substitution
daizj
shell脚本
#!/bin/sh
/data/script/common/run_cmd.exp 192.168.13.168 "impala-shell -islave4 -q 'insert OVERWRITE table imeis.${tableName} select ${selectFields}, ds, fnv_hash(concat(cast(ds as string), im
- Java SE 第二讲(原生数据类型 Primitive Data Type)
dcj3sjt126com
java
Java SE 第二讲:
1. Windows: notepad, editplus, ultraedit, gvim
Linux: vi, vim, gedit
2. Java 中的数据类型分为两大类:
1)原生数据类型 (Primitive Data Type)
2)引用类型(对象类型) (R
- CGridView中实现批量删除
dcj3sjt126com
PHPyii
1,CGridView中的columns添加
array(
'selectableRows' => 2,
'footer' => '<button type="button" onclick="GetCheckbox();" style=&
- Java中泛型的各种使用
dyy_gusi
java泛型
Java中的泛型的使用:1.普通的泛型使用
在使用类的时候后面的<>中的类型就是我们确定的类型。
public class MyClass1<T> {//此处定义的泛型是T
private T var;
public T getVar() {
return var;
}
public void setVa
- Web开发技术十年发展历程
gcq511120594
Web浏览器数据挖掘
回顾web开发技术这十年发展历程:
Ajax
03年的时候我上六年级,那时候网吧刚在小县城的角落萌生。传奇,大话西游第一代网游一时风靡。我抱着试一试的心态给了网吧老板两块钱想申请个号玩玩,然后接下来的一个小时我一直在,注,册,账,号。
彼时网吧用的512k的带宽,注册的时候,填了一堆信息,提交,页面跳转,嘣,”您填写的信息有误,请重填”。然后跳转回注册页面,以此循环。我现在时常想,如果当时a
- openSession()与getCurrentSession()区别:
hetongfei
javaDAOHibernate
来自 http://blog.csdn.net/dy511/article/details/6166134
1.getCurrentSession创建的session会和绑定到当前线程,而openSession不会。
2. getCurrentSession创建的线程会在事务回滚或事物提交后自动关闭,而openSession必须手动关闭。
这里getCurrentSession本地事务(本地
- 第一章 安装Nginx+Lua开发环境
jinnianshilongnian
nginxluaopenresty
首先我们选择使用OpenResty,其是由Nginx核心加很多第三方模块组成,其最大的亮点是默认集成了Lua开发环境,使得Nginx可以作为一个Web Server使用。借助于Nginx的事件驱动模型和非阻塞IO,可以实现高性能的Web应用程序。而且OpenResty提供了大量组件如Mysql、Redis、Memcached等等,使在Nginx上开发Web应用更方便更简单。目前在京东如实时价格、秒
- HSQLDB In-Process方式访问内存数据库
liyonghui160com
HSQLDB一大特色就是能够在内存中建立数据库,当然它也能将这些内存数据库保存到文件中以便实现真正的持久化。
先睹为快!
下面是一个In-Process方式访问内存数据库的代码示例:
下面代码需要引入hsqldb.jar包 (hsqldb-2.2.8)
import java.s
- Java线程的5个使用技巧
pda158
java数据结构
Java线程有哪些不太为人所知的技巧与用法? 萝卜白菜各有所爱。像我就喜欢Java。学无止境,这也是我喜欢它的一个原因。日常
工作中你所用到的工具,通常都有些你从来没有了解过的东西,比方说某个方法或者是一些有趣的用法。比如说线程。没错,就是线程。或者确切说是Thread这个类。当我们在构建高可扩展性系统的时候,通常会面临各种各样的并发编程的问题,不过我们现在所要讲的可能会略有不同。
- 开发资源大整合:编程语言篇——JavaScript(1)
shoothao
JavaScript
概述:本系列的资源整合来自于github中各个领域的大牛,来收藏你感兴趣的东西吧。
程序包管理器
管理javascript库并提供对这些库的快速使用与打包的服务。
Bower - 用于web的程序包管理。
component - 用于客户端的程序包管理,构建更好的web应用程序。
spm - 全新的静态的文件包管
- 避免使用终结函数
vahoa.ma
javajvmC++
终结函数(finalizer)通常是不可预测的,常常也是很危险的,一般情况下不是必要的。使用终结函数会导致不稳定的行为、更差的性能,以及带来移植性问题。不要把终结函数当做C++中的析构函数(destructors)的对应物。
我自己总结了一下这一条的综合性结论是这样的:
1)在涉及使用资源,使用完毕后要释放资源的情形下,首先要用一个显示的方