python拟合节距正态分布_python-numpy-正态分布的模拟--pdf图--cdf图---正态分布的拟合...
# Draw 100000 samples from Normal distribution with stds of interest: samples_std1, samples_std3, samples_std10
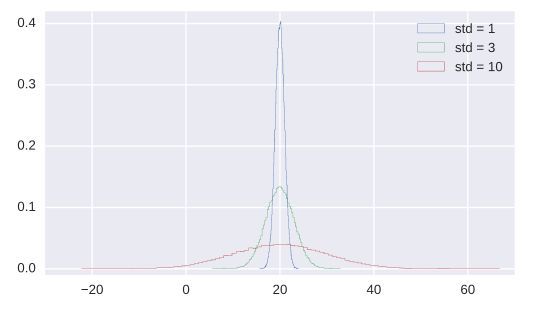
samples_std1=np.random.normal(20,1,size=100000)
samples_std3=np.random.normal(20,3,size=100000)
samples_std10=np.random.normal(20,10,size=100000)
# Make histograms
plt.hist(samples_std1,bins=100,normed=True,histtype='step')
plt.hist(samples_std3,bins=100,normed=True,histtype='step')
plt.hist(samples_std10,bins=100,normed=True,histtype='step')
# Make a legend, set limits and show plot
_ = plt.legend(('std = 1', 'std = 3', 'std = 10'))
plt.ylim(-0.01, 0.42)
plt.show()
cdf图的画法
# Generate CDFs
x_std1,y_std1=ecdf(samples_std1)
x_std3,y_std3=ecdf(samples_std3)
x_std10,y_std10=ecdf(samples_std10)
# Plot CDFs
plt.plot(x_std1,y_std1,marker='.',linestyle='none')
plt.plot(x_std3,y_std3,marker='.',linestyle='none')
plt.plot(x_std10,y_std10,marker='.',linestyle='none')
# Make 2% margin
plt.margins(0.02)
# Make a legend and show the plot
_ = plt.legend(('std = 1', 'std = 3', 'std = 10'), loc='lower right')
plt.show()

正态分布的拟合
# Compute mean and standard deviation: mu, sigma
mu=np.mean(belmont_no_outliers)
sigma=np.std(belmont_no_outliers)
# Sample out of a normal distribution with this mu and sigma: samples
samples=np.random.normal(mu,sigma,10000)
# Get the CDF of the samples and of the data
x,y=ecdf(belmont_no_outliers)
x_theor,y_theor=ecdf(samples)
# Plot the CDFs and show the plot
_ = plt.plot(x_theor, y_theor)
_ = plt.plot(x, y, marker='.', linestyle='none')
plt.margins(0.02)
_ = plt.xlabel('Belmont winning time (sec.)')
_ = plt.ylabel('CDF')
plt.show()
