时域抽样与频域抽样【信号与系统三】
时域抽样与频域抽样
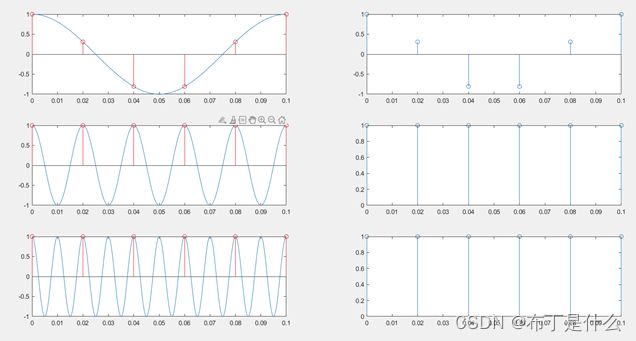
- 1. 在[0,0.1]区间上以50Hz的抽样频率对下列3个信号分别进行抽样
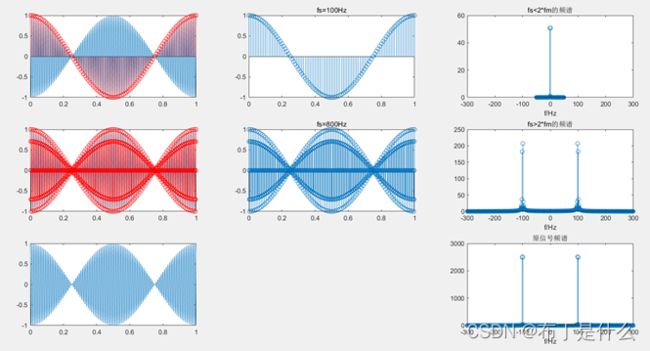
- 2. 产生幅度调制信号 ,绘出该信号时域和频域波形
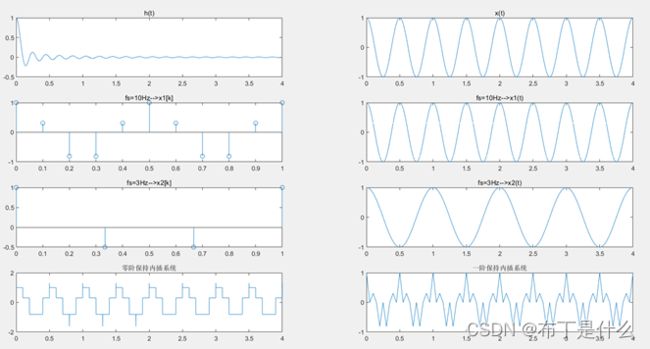
- 3. 对连续信号进行抽样以得到离散序列,并进行重建。分别使用零阶保持内插系统h0(t)、一阶保持内插系统h1(t)恢复连续时间信号,画出重建信号的波形
1. 在[0,0.1]区间上以50Hz的抽样频率对下列3个信号分别进行抽样
![]()
![]()
![]()
t0= 0:0.0001:0.1;
Fs=50;

x0=cos(2*pi*10*t0);
subplot(3,2,1);
plot(t0,x0);
hold on;
t=0:1/Fs:0.1;
x=cos(2*pi*10*t);
stem(t,x,'r');
hold off;
subplot(3,2,2);
stem(t,x);

x1=cos(2*pi*50*t0);
subplot(3,2,3);
plot(t0,x1);
hold on;
x=cos(2*pi*50*t);
stem(t,x,'r');
hold off;
subplot(3,2,4);
stem(t,x);

x2=cos(2*pi*100*t0);
subplot(3,2,5);
plot(t0,x2);
hold on;
x=cos(2*pi*100*t);
stem(t,x,'r');
subplot(3,2,6);
stem(t,x);
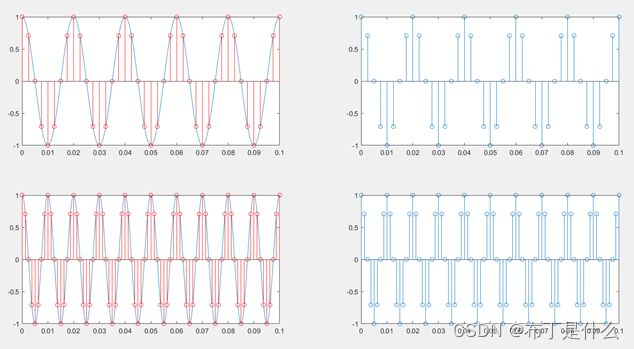
0= 0:0.0001:0.1;
Fs=400;
t=0:1/Fs:0.1;
x1=cos(2*pi*50*t0);
subplot(2,2,1);
plot(t0,x1);
hold on;
x=cos(2*pi*50*t);
stem(t,x,'r');
hold off;
subplot(2,2,2);
stem(t,x);

Fs=800;
t=0:1/Fs:0.1;
x2=cos(2*pi*100*t0);
subplot(2,2,3);
plot(t0,x2);
hold on;
x=cos(2*pi*100*t);
stem(t,x,'r');
subplot(2,2,4);
stem(t,x);
2. 产生幅度调制信号 ,绘出该信号时域和频域波形
![]()
tend=1;
t0= 0:0.0001:tend;
x0=cos(2*pi*t0).*cos(2*pi*100*t0);

subplot(3,3,1);
plot(t0,x0);
hold on;
fs1=100;
t1=0:1/fs1:tend;
x1=cos(2*pi*t1).*cos(2*pi*100*t1);
stem(t1,x1,'r');
hold off;
subplot(3,3,2);
stem(t1,x1);
title('fs=100Hz')

n1=length(x1);
w1=(-n1/2:n1/2-1)*fs1/n1;
X1=fftshift(fft(x1));
subplot(3,3,3);
stem(w1,abs(X1));
xlabel('f/Hz');
axis([-300,300,0,60]);

subplot(3,3,4);
plot(t0,x0);
hold on;
fs2=800;
t2=0:1/fs2:tend;
x2=cos(2*pi*t2).*cos(2*pi*100*t2);
stem(t2,x2,'r');
hold off;
subplot(3,3,5);
stem(t2,x2);
title('fs=800Hz')

n2=length(x2);
w2=(-n2/2:n2/2-1)*fs2/n2;
X2=fftshift(fft(x2));
subplot(3,3,6);
stem(w2,abs(X2));
axis([-300,300,0,250]);
xlabel('f/Hz');

fs=1/0.0001;
n=length(x0);
w=(-n/2:n/2-1)*fs/n;
X=fftshift(fft(x0));
subplot(3,3,9);
stem(w,abs(X));
axis([-300,300,0,3000]);
xlabel('f/Hz');
subplot(3,3,7);
plot(t0,x0);
3. 对连续信号进行抽样以得到离散序列,并进行重建。分别使用零阶保持内插系统h0(t)、一阶保持内插系统h1(t)恢复连续时间信号,画出重建信号的波形
t=0:0.001:4;
x=cos(2*pi*2*t);
subplot(4,2,2);
plot(t,x);
title('x(t)');

fs1=10;
ht=sin(pi*t*fs1)./(pi*t*fs1);
subplot(4,2,1);
plot(t,ht);
title('h(t)');

T=1/fs1;
t1=0:T:1;
x1=cos(2*pi*2*t1);
subplot(4,2,3);
stem(t1,x1);
title('fs=10Hz-->x1[k]');

N=1000;
y=0;
for n=-N:1:N
    y=y+cos(2*pi*2*n*T).*sin(pi*(t-n*T)*fs1)./(pi*(t-n*T)*fs1);
end
subplot(4,2,4);
plot(t,y);
title('fs=10Hz-->x1(t)');

fs2=3;
T=1/fs2;
t2=0:T:1;
x2=cos(2*pi*2*t2);
subplot(4,2,5);
stem(t2,x2);
title('fs=3Hz-->x2[k]');

y=0;
for n=-N:1:N
    y=y+cos(2*pi*2*n*T).*sin(pi*(t-n*T)*fs2)./(pi*(t-n*T)*fs2);
end
subplot(4,2,6);
plot(t,y);
title('fs=3Hz-->x2(t)');

T=1/fs1;
h2t=stepfun(t,0)-stepfun(t,T);
y=0;
for n=-N:1:N
    y=y+cos(2*pi*2*n*T).*(stepfun(t-n*T,0)-stepfun(t-n*T,T));
end
subplot(4,2,7);
plot(t,y);
title('零阶保持内插系统 ');

t=-4:0.001:4;
h3t=tripuls(t,T,0);
y=0;
for n=-N:1:N
    y=y+cos(2*pi*2*n*T).*tripuls(t-n*T,T,0);
end
subplot(4,2,8);
plot(t,y);
axis([0,4,-1,1]);
title('一阶阶保持内插系统 ');


