指针表值识别(传统算法)
指针表值识别(传统算法)
算法流程:
1、定制模板
2、 使用模板和源图片进行匹配
3、 选取源图片中的最佳匹配区域
4、 对匹配区域使用K-means二值化
5、删除二值化图中的无用边缘区域
6、 根据模板选定指针的旋转中心
7、 拟合指针角度
8、 映射到真实指针值
选取模板图:

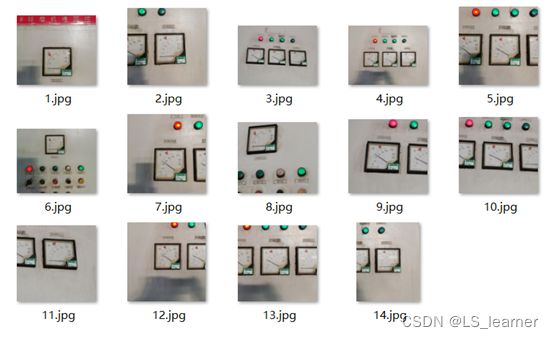
现场使用手机采集的源图片:
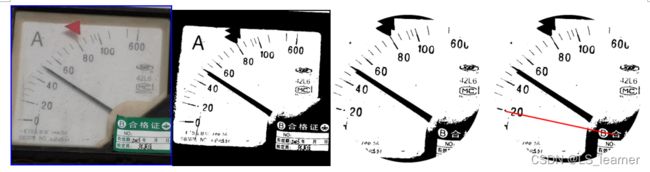
获取源图片中的最佳匹配区域(表识别):
考虑模板的大小和现场中实际采集的图片中的表大小不同,所以这里对模板表的大小在一定范围内进行缩放,使得匹配更加准确:

对匹配的区域进行K-means二值化处理:

删除边缘无用区域,避免后续给指针拟合带来负面影响:

根据选取模板的旋转中心,拟合指针:(指针从-10度转到90度)
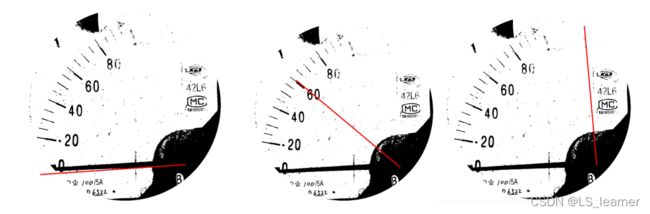
根据拟合指针和真实指针的像素重合程度,确定真实指针的角度:
![]()
根据以上算法,对采集的图片进行实验,实验证明该方案测试效果较好,特别是对于小场景环境下,该方案快速高效。(指针从-10度转到90度,寻找和实际指针最好的拟合角度,最后一列为某一时刻拟合指针随机角度,并非都是拟合的真实角度)

测试结果:
![]()

测试结果:
![]()

测试结果:
![]()
测试结果:
![]()
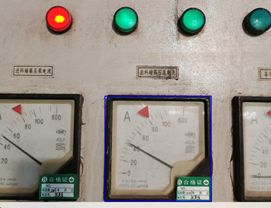
缺点:是对于含有多个仪表的情况下,只能选取一个仪表测试,对于这个缺点,可以在现场应用中,每次只测试一个仪表,来避免该缺点。

非完整的仪表,只识别完整的仪表:
完整代码如下:
import cv2
import numpy as np
from sklearn.cluster import KMeans
from sklearn.utils import shuffle
from math import cos, pi, sin


def get_match_rect(template,img,method):
    '''获取模板匹配的矩形的左上角和右下角的坐标'''
    # 由于模板的大小和原图片中的大小不一致,所以需要对图片模板大小进行缩放,以准确匹配源图像中的尺寸
    max_val_ = 0
    max_loc_ = 0
    w_ = 0
    h_ = 0
    count = 0
    for dscale in np.linspace(0.1,2,100):  # 对模板的大小进行缩放,从0.1倍到2倍大小
        count+=1
        print(count)
        template_re = cv2.resize(template,(int(template.shape[1]*dscale),int(template.shape[0]*dscale)))
        w, h = template_re.shape[1],template_re.shape[0]
        try:
            res = cv2.matchTemplate(img, template_re, method)/(w*h)  # 滑动窗口在源图中寻找模板图,并给出每个位置的匹配相似程度
            mn_val, max_val, min_loc, max_loc = cv2.minMaxLoc(res) # 找到像素值的最大和最小值的位置
            if max_val > max_val_:
                max_val_ = max_val
                max_loc_ = max_loc
                w_ = w
                h_ = h
        except:
            pass
    max_loc = max_loc_
    w = w_
    h = h_
    # 使用不同的方法,对结果的解释不同
    if method in [cv2.TM_SQDIFF, cv2.TM_SQDIFF_NORMED]:
        top_left = min_loc
    else:
        top_left = max_loc
    bottom_right = (top_left[0] + w, top_left[1] + h)
    return top_left,bottom_right

def get_center_point(top_left,bottom_right):
    '''传入左上角和右下角坐标,获取中心点'''
    c_x, c_y = ((np.array(top_left) + np.array(bottom_right)) / 2).astype(np.int)
    return c_x,c_y

def get_circle_field_color(img,center,r,thickness):
    '''获取中心圆形区域的色值集'''
    temp=img.copy().astype(np.int)
    cv2.circle(temp,center,r,-100,thickness=thickness)
    return img[temp == -100]

def v2_by_center_circle(img,colors):
    '''二值化通过中心圆的颜色集合'''
    for i in range(img.shape[0]):
        for j in range(img.shape[1]):
            a = img[i, j]
            if a in colors:
                img[i, j] = 0
            else:
                img[i, j] = 255

def v2_by_k_means(img):
    '''使用k-means二值化'''
    original_img = np.array(img, dtype=np.float64)
    src = original_img.copy()
    delta_y = int(original_img.shape[0] * (0.2))    # 原始图片中提取类似模板图片的高的0.2倍  (0.2需要修改的参数)
    delta_x = int(original_img.shape[1] * (0.2))    # 原始图片中提取类似模板图片的宽的0.2倍   (0.2需要修改的参数)
    original_img = original_img[delta_y:-delta_y, delta_x:-delta_x]  # 类模板图片的中心区域,用于k-means的训练样本的区域
    h, w, d = src.shape
    print('类模板的宽、高、通道数:',w, h, d)
    dts = min([w, h])
    # print(dts)
    r2 = (dts / 2.5) ** 2   # 距离中心位置的距离平方超过这个位置,则清除  (需要修改的参数)
    c_x, c_y = w / 2, h / 2   # 图片的中心位置
    a: np.ndarray = original_img[:, :, 0:3].astype(np.uint8)
    # 获取尺寸(宽度、长度、深度)
    height, width = original_img.shape[0], original_img.shape[1]
    depth = 3
    # print(depth)
    image_flattened = np.reshape(original_img, (width * height, depth))
    '''
    用K-Means算法进行像素的二值分类学习
    '''
    image_array_sample = shuffle(image_flattened, random_state=0)
    estimator = KMeans(n_clusters=2, random_state=0)  # k-means评估器
    estimator.fit(image_array_sample)  # 如果k-means处理效果不佳可以缩小算法的训练样本的区域
    '''
    为原始图片的每个像素进行类的分配
    '''
    src_shape = src.shape
    new_img_flattened = np.reshape(src, (src_shape[0] * src_shape[1], depth))  # 类模板图展开
    cluster_assignments = estimator.predict(new_img_flattened)  # 对类模板图的每个像素点进行分类
    '''
    建立通过压缩调色板和类分配结果创建压缩后的图片
    '''
    compressed_palette = estimator.cluster_centers_  # 获取聚类中心,每行为rgb的值,两个聚类点
    # print(compressed_palette)
    a = np.apply_along_axis(func1d=lambda x: np.uint8(compressed_palette[x]), arr=cluster_assignments, axis=0)  # 把每个像素点变为到聚类中心点上
    img = a.reshape(src_shape[0], src_shape[1], depth)
    # print(compressed_palette[0, 0])
    threshold = (compressed_palette[0, 0] + compressed_palette[1, 0]) / 2
    img[img[:, :, 0] > threshold] = 255
    img[img[:, :, 0] < threshold] = 0
    cv2.imshow('K-Means Binarization', img)
    cv2.waitKey(0)
    cv2.destroyAllWindows()
    for x in range(w):
        for y in range(h):
            distance = ((x - c_x) ** 2 + (y - c_y) ** 2) # 距离图片中心位置较远的区域,清空处理
            if distance > r2:
                pass
                img[y, x] = (255, 255, 255)
    cv2.imshow('sd', img)
    cv2.waitKey(0)
    cv2.destroyAllWindows()
    return img

def get_pointer_rad(img):
    '''获取角度'''
    shape = img.shape
    c_y, c_x, depth = int(shape[0]*0.75), int(shape[1]*0.75), shape[2]   # 寻找指针的旋转中心位置  (0.75是需要修改的参数)

    x1=c_x+c_x*0.8
    src = img.copy()
    freq_list = []

    for i in range(170,270): # 拟合指针的角度范围,水平向右为0度,逆时针为正方向(使用自己的数据集,需要自定义的参数)
        x = (x1 - c_x) * cos(i * pi / 180) + c_x
        y = (x1 - c_x) * sin(i * pi / 180) + c_y
        temp = src.copy()
        cv2.line(temp, (c_x, c_y), (int(x), int(y)), (0, 0, 255), thickness=3)  # 绘制直线
        t1 = img.copy()
        t1[temp[:, :, 2] == 255] = 255
        c = img[temp[:, :, 2] == 255]
        points = c[c == 0]
        freq_list.append((len(points), i))
        cv2.imshow('d', temp)
        # cv2.imshow('d1', t1)
        cv2.waitKey(1)
    cv2.destroyAllWindows()
    return max(freq_list, key=lambda x: x[0])[1]-180


if __name__ == '__main__':
    methods = ['cv2.TM_CCOEFF', 'cv2.TM_CCOEFF_NORMED', 'cv2.TM_CCORR',
               'cv2.TM_CCORR_NORMED', 'cv2.TM_SQDIFF', 'cv2.TM_SQDIFF_NORMED']
    method = cv2.TM_CCOEFF
    for x in range(2,15):  # (使用自己的数据集,需要自定义的参数,测试图片的个数)
        #获取测试图像
        img_s = cv2.imread('my_Test/%s.jpg'%x)
        img=cv2.cvtColor(img_s,cv2.COLOR_BGR2GRAY)  # BGR图转化为灰色图
        template = cv2.imread('template2.jpg')
        template=cv2.cvtColor(template,cv2.COLOR_BGR2GRAY)
        #匹配并返回矩形坐标
        top_left,bottom_right=get_match_rect(template,img,method) # 获得模板再源图中的匹配位置(左上角和右下角)
        c_x,c_y=get_center_point(top_left,bottom_right)  # 获得左上角和右小角的中心位置
        print(c_x,c_y)
        #绘制矩形
        cv2.rectangle(img_s, top_left, bottom_right, 255, 8)
        cv2.imshow('img',cv2.resize(img_s,(int(img.shape[1]*0.5),int(img.shape[0]*0.5))))
        cv2.waitKey(0)
        cv2.destroyAllWindows()
        #################################################################
        new_ = img_s[top_left[1]:bottom_right[1] + 1, top_left[0]:bottom_right[0] + 1]  # 从源图像中提取的和模板图片最相似的区域
        # 二值化图像
        cv2.imshow('ererss',new_)
        cv2.waitKey(0)
        cv2.destroyAllWindows()
        img=v2_by_k_means(new_)  # 使用k-means二值化图
        rad=get_pointer_rad(img) # 得到拟合指针最优角度
        print('当前绘图角度:',rad,'度')
        #################################################################
        # 计算真实指针表值80对应56°
        print('指针表值:',rad/56.0*80.0)
cv2.destroyAllWindows()
需要注意的问题:
如果需要使用自己的数据,需要更改上述代码中的部分参数,不过不用担心,我已经把需要修改的参数进行了备注。有问题可以评论区讨论~~
完整代码及其数据集:
https://gitee.com/liushuo-max/yibiao_rec/tree/main/
参考:
https://blog.csdn.net/a1053904672/article/details/88759335?utm_medium=distribute.pc_relevant.none-task-blog-BlogCommendFromMachineLearnPai2-2.channel_param&depth_1-utm_source=distribute.pc_relevant.none-task-blog-BlogCommendFromMachineLearnPai2-2.channel_param
解决了参考方案中模板大小需要和源图片大小严格相等的问题,且不需要双模板两次匹配。