量化交易Python数据分析
基于python的量化交易分析
采用:
1. N日择时策略+ATR风险控制
# N日择时策略+ATR
def Nbreakstrategy(self,data,  N1, N2, n_win, n_loss):
    # N1天内最高价
    global start
    data['N1_high'] = data.High.rolling(window=N1).max()
    data['N1_high'] = data.N1_high.shift(1)
    max_val = data.Close.expanding().max()
    data['N1_high'].fillna(value=max_val, inplace=True)

    # N2天内最低价
    data['N2_low'] = data.Low.rolling(window=N2).min()
    data['N2_low'] = data.N2_low.shift(1)
    min_val = data.Close.expanding().min()
    data['N2_low'].fillna(value=min_val, inplace=True)


    # ATR止盈止损判断
    buy_price = 0
    for k_index, today in data.iterrows():
        tick = round(today.Close * 0.01, 2)
        # 买入
        if (today.Close - tick) > today.N1_high:
            print('N day buy: {} {}'.format(k_index,today.Close))
            buy_price = today.Close
            data.loc[k_index, 'signal'] = 1
        # 止损,收盘价少于买入价,卖出
        elif (buy_price != 0) and (buy_price > today.Close + tick) and ((buy_price - today.Close - tick) > n_loss * today.atr14):
            #print('stop loss: {} {} {}'.format(k_index, today.Close, buy_price))
            data.loc[k_index, 'signal'] = 0
            buy_price = 0
        # 止盈:收盘价多于买入价,卖出
        elif (buy_price != 0) and (buy_price < today.Close - tick) and ((today.Close - buy_price + tick) > n_win * today.atr14):
            #print('stop win: {} {} {}'.format(k_index, today.Close, buy_price))
            data.loc[k_index, 'signal'] = 0
            buy_price = 0
        elif today.Close + tick < today.N2_low:
            #print('N day sell: {} {}'.format(k_index, today.Close))
            data.loc[k_index, 'signal'] = 0
            buy_price = 0
        else:
            pass

    # 买入 / 卖出信号list
    data['signal'].fillna(method='ffill', inplace = True)
    data['signal'] = data.signal.shift(1)
    data['signal'].fillna(method='bfill', inplace=True)

    for k_index, today in data.iterrows():
        # 买入/卖出 执行
        if today.signal == 1 and self.hold_state == 0: # 买入
            start = data.index.get_loc(k_index) # 区间开始日期
            self.hold_state = -1
            self.stock_num = int(self.init_money / today.Close) # 资金转化为股票
            # 仓位管理
            self.send_order(code=self.stock_code, amount=int(self.init_money * 0.01 / today.atr14),
                            price=today.Close, order_type='buy')
            self.init_money = 0

            self.graph_trade.annotate('买入',xy=(k_index,data.Close.asof(k_index)),
                                      xytext=(k_index,data.Close.asof(k_index)+2),
                                      arrowprops=dict(facecolor='r',shrink=0.1),
                                      horizontalalignment='left',verticalalignment='top')
        elif today.signal == 0 and self.hold_state == -1: # 卖出
            end = data.index.get_loc(k_index)
            # 手续费:印花税1‰,手续费5元
            profit = self.stock_num * today.Close
            fee = profit * 0.0001 - 5
            self.init_money = round((profit - fee),1) # 股票转化为资金
            self.hold_state = 0
            self.market_value = 0
            # 仓位管理
            self.send_order(code=self.stock_code, amount=self.hold_available(code = "600410.SS"), price=today.Close, order_type='sell')

            if data.Close[end] < data.Close[start]:
                # 赔钱,绿色
                self.graph_trade.fill_between(data.index[start:end],0,
                                              data.Close[start:end],color='green',alpha=0.8)
            else:
                # 赚钱 红色
                self.graph_trade.fill_between(data.index[start:end], 0,
                                              data.Close[start:end], color='red', alpha=0.8)

            self.graph_trade.annotate('卖出',xy=(k_index,data.Close.asof(k_index)),
                                      xytext=(k_index+datetime.timedelta(days=5),
                                              data.Close.asof(k_index)+2),
                                      arrowprops=dict(facecolor='g',shrink=0.1),
                                      horizontalalignment='left',verticalalignment='top')

        latest_val = self.latest_assets(today.Close)
        data.loc[k_index, 'total_position'] = latest_val
        if self.hold_state == -1: # 持股状态
            self.market_value = int(self.stock_num * today.Close)
            data.loc[k_index, 'total'] = self.market_value
        else: # 空仓
            data.loc[k_index, 'total'] = self.init_money
    print('total value is {}'.format(data['total'][-1]))
    self.resultanalysis(data)
    return data['total'][-1] # 每次返回
复制代码
2. 蒙特卡洛优化算法优化策略输入参数
# 使用蒙特卡洛方法挑选出最优的N1,N2,止盈,止损点
# 25,5,2.3,0.7
def montcarlo(self,data, n):
    n1_min, n1_max = 10, 30
    n2_min, n2_max = 5, 15
    win_min, win_max = 1.5, 3
    loss_min, loss_max = 0.5, 1.2

    ma_ls = []
    profit_ls = []

    # 每次随机生成一组N1,N2,止盈,止损倍数,循环N日择时策略并把每次执行策略的最终资产存入数组
    # 最终得到n次执行后,得到最大资产的一组随机数,作为最优策略的输入参数
    for i in range(0, n+1):
        n1 = int(random.uniform(n1_min,n1_max))
        n2 = int(random.uniform(n2_min, n2_max))
        win = round(random.uniform(win_min, win_max),1)
        loss = round(random.uniform(loss_min, loss_max),1)
        ma_ls.append([n1,n2,win,loss])
        # 策略代码
        trade = QuantAnalysis()
        profit_ls.append(trade.Nbreakstrategy(data, n1, n2, win, loss))


    profit_max = max(profit_ls)
    ma_max = ma_ls[profit_ls.index(profit_max)]
    print("maximize the profit is %s and correspond parametes are %s " % (profit_max, ma_max))
    return ma_ls
复制代码
3. 基于ATR的仓位管理
# 仓位管理
self.send_order(code=self.stock_code, amount=int(self.init_money * 0.01 / today.atr14),price=today.Close, order_type='buy')
self.send_order(code=self.stock_code, amount=self.hold_available(code = "600410.SS"), price=today.Close, order_type='sell')
复制代码
4. 滑点收盘价的1%
在每一次买入卖出,止盈止损的过程中加入滑点值,让结果没那么‘完美’,更符合实际的情况。
复制代码
5. 印花税 1‰,手续费5元
在卖出时将印花税,手续费加入
profit = self.stock_num * today.Close
fee = profit * 0.0001 - 5
复制代码
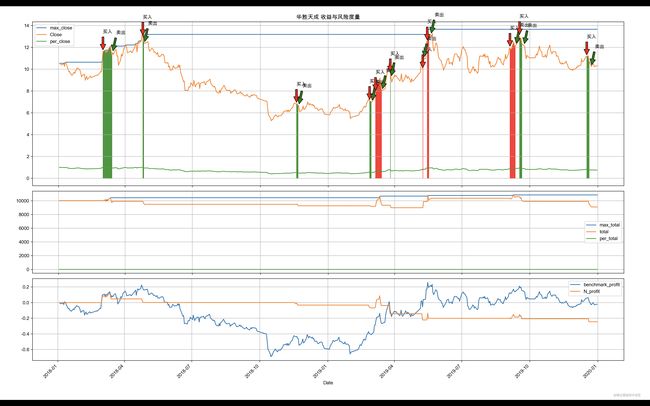
6. 结果生成图像:
    a. 买卖区间图
    b. 基准收益/策略收益对比图
    c. 总资产图(无策略的总资产+N日择时策略下的总资产+仓位管理的总资产+最大总资产)

    无仓位管理,无手续费,经过蒙特卡洛筛选出最优N日择时策略后的执行结果图
复制代码
    增加仓位管理,增加手续费后的结果图,可以对比看出仓位管理的优势,总资产比不实施仓位管理要高了很多
复制代码
    从图中可以看出当买入点较高时,股票开始下跌,策略能够及时止损,本次策略使用的止损点为0.7,卖出时能够较好的获利,止盈点为2.3。

    采用量化分析的方式,可以对一只股票的交易历史有一个很好的分析,通过模拟策略来进行买卖,检验自己策略的好坏,但是有个疑问,怎么
