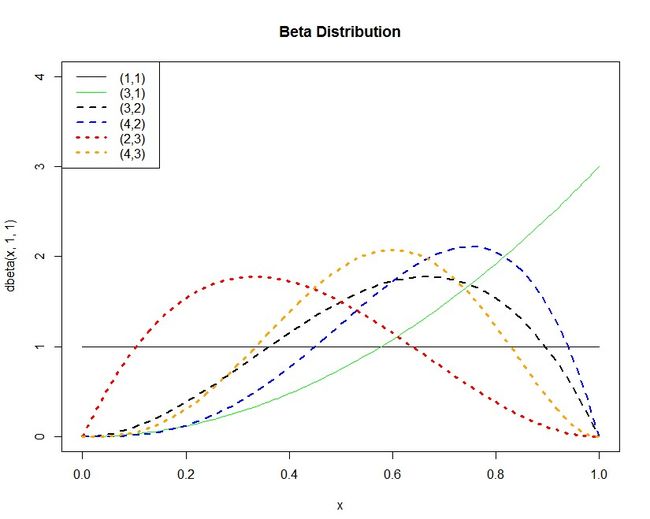
描述性统计分析的一个实例;贝塔分布
> curve ( dbeta(x, 1, 1), xlim = c(0,1), ylim = c(0,4) )
> curve ( dbeta(x, 3, 1), add = T, col = "green" )
> curve ( dbeta(x, 3, 2), add = T, lty = 2, lwd = 2)
> curve ( dbeta(x, 4, 2), add = T, lty = 2, lwd = 2, col = 'blue' )
> curve ( dbeta(x, 2, 3), add = T, lty = 3, lwd = 3, col = 'red' )
> curve ( dbeta(x, 4, 3), add = T, lty = 3, lwd = 3, col = 'orange' )
> title ( main = "Beta Distribution" )
> legend ( par('usr')[1], par('usr')[4], xjust = 0,
+ c('(1,1)', '(3,1)', '(3,2)', '(4,2)', '(2,3)', '(4,3)'),
+ lwd = c(1, 1, 2, 2, 3, 3),
+ lty = c(1, 1, 2, 2, 3, 3),
+ col = c(par('fg'), 'green', par('fg'), 'blue', 'red', 'orange'))
————————————————————————————————————————————————————————
curve 简介:
http://127.0.0.1:25686/library/graphics/html/curve.html
Description
Draws a curve corresponding to a function over the interval [from, to]. curve can plot also an expression in the variable xname, default x.
Usage
curve(expr, from = NULL, to = NULL, n = 101, add = FALSE,
      type = "l", xname = "x", xlab = xname, ylab = NULL,
      log = NULL, xlim = NULL, ...)

## S3 method for class 'function'
plot(x, y = 0, to = 1, from = y, xlim = NULL, ylab = NULL, ...)
Arguments
expr |
The name of a function, or a call or an expression written as a function of |
x |
a ‘vectorizing’ numeric R function. |
y |
alias for |
from, to |
the range over which the function will be plotted. |
n |
integer; the number of x values at which to evaluate. |
add |
logical; if |
xlim |
|
type |
plot type: see |
xname |
character string giving the name to be used for the x axis. |
xlab, ylab, log, ... |
labels and graphical parameters can also be specified as arguments. See ‘Details’ for the interpretation of the default for For the |
