遗传算法的运用
遗传算法定义
- 首先,我们设定好了国民的初始人群大小。
- 然后,我们定义了一个函数,用它来区分好人和坏人。
- 再次,我们选择出好人,并让他们繁殖自己的后代。
- 最后,这些后代们从原来的国民中替代了部分坏人,并不断重复这一过程。
因此,为了形式化定义一个遗传算法,我们可以将它看作一个优化方法,它可以尝试找出某些输入,凭借这些输入我们便可以得到最佳的输出值或者是结果。遗传算法的工作方式也源自于生物学,具体流程见下图:

遗传算法具体步骤

第一步是定义我们的总体。总体中包含了个体,每个个体都有一套自己的染色体。

接下来,让我们来计算一下前两条染色体的适应度分数。对于 A1 染色体 [100110] 而言,有:

类似地,对于 A2 染色体 [001110] 来说,有:

对于这个问题,我们认为,当染色体包含更多生存分数时,也就意味着它的适应性更强。
因此,由图可知,染色体 1 适应性强于染色体 2。
选择
现在,我们可以开始从总体中选择适合的染色体,来让它们互相『交配』,产生自己的下一代了。这个是进行选择操作的大致想法,但是这样将会导致染色体在几代之后相互差异减小,失去了多样性。因此,我们一般会进行「轮盘赌选择法」(Roulette Wheel Selection method)。
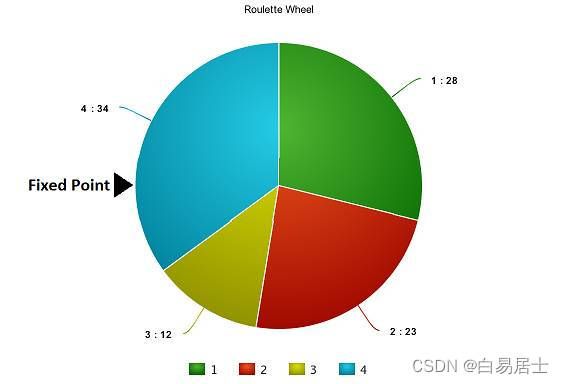
想象有一个轮盘,现在我们将它分割成 m 个部分,这里的 m 代表我们总体中染色体的个数。每条染色体在轮盘上占有的区域面积将根据适应度分数成比例表达出来。

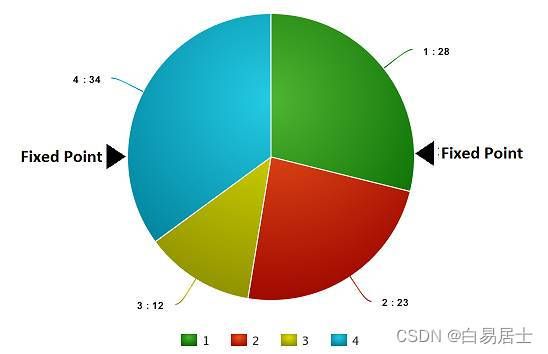
现在,这个轮盘开始旋转,我们将被图中固定的指针(fixed point)指到的那片区域选为第一个亲本。然后,对于第二个亲本,我们进行同样的操作。有时候我们也会在途中标注两个固定指针,如下图:

通过这种方法,我们可以在一轮中就获得两个亲本。我们将这种方法成为「随机普遍选择法」(Stochastic Universal Selection method)。
交叉
在上一个步骤中,我们已经选择出了可以产生后代的亲本染色体。那么用生物学的话说,所谓「交叉」,其实就是指的繁殖。现在我们来对染色体 1 和 4(在上一个步骤中选出来的)进行「交叉」,见下图:

这是交叉最基本的形式,我们称其为「单点交叉」。这里我们随机选择一个交叉点,然后,将交叉点前后的染色体部分进行染色体间的交叉对调,于是就产生了新的后代。
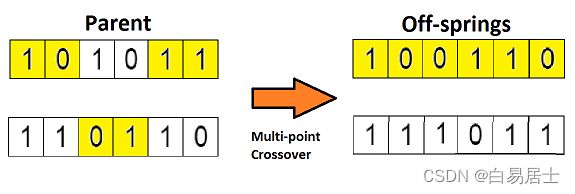
如果你设置两个交叉点,那么这种方法被成为「多点交叉」,见下图:

变异
如果现在我们从生物学的角度来看这个问题,那么请问:由上述过程产生的后代是否有和其父母一样的性状呢?答案是否。在后代的生长过程中,它们体内的基因会发生一些变化,使得它们与父母不同。这个过程我们称为「变异」,它可以被定义为染色体上发生的随机变化,正是因为变异,种群中才会存在多样性。
下图为变异的一个简单示例:


在进行完一轮「遗传变异」之后,我们用适应度函数对这些新的后代进行验证,如果函数判定它们适应度足够,那么就会用它们从总体中替代掉那些适应度不够的染色体。这里有个问题,我们最终应该以什么标准来判断后代达到了最佳适应度水平呢?
一般来说,有如下几个终止条件:
1. 在进行 X 次迭代之后,总体没有什么太大改变。
2. 我们事先为算法定义好了进化的次数。
3. 当我们的适应度函数已经达到了预先定义的值。
好了,现在我假设你已基本理解了遗传算法的要领,那么现在让我们用它在数据科学的场景中应用一番。
用 TPOT 库来实现
那么首先我们来快速浏览一下 TPOT 库(Tree-based Pipeline Optimisation Technique,树形传递优化技术),该库基于 scikit-learn 库建立。下图为一个基本的传递结构。

图中的灰色区域用 TPOT 库实现了自动处理。实现该部分的自动处理需要用到遗传算法。
我们这里不深入讲解,而是直接应用它。为了能够使用 TPOT 库,你需要先安装一些 TPOT 建立于其上的 python 库。下面我们快速安装它们:
# installing DEAP, update_checker and tqdm

pip install deap update_checker tqdm
# installling TPOT
pip install tpot
这里,我用了 Big Mart Sales(数据集地址:https://datahack.analyticsvidhya.com/contest/practice-problem-big-mart-sales-iii/)数据集,为实现做准备,我们先快速下载训练和测试文件,以下是 python 代码:
# import basic libraries

import numpy as np
import pandas as pd
import matplotlib.pyplot as plt
%matplotlib inline
from sklearn import preprocessing
from sklearn.metrics import mean_squared_error
## preprocessing
### mean imputations

train['Item_Weight'].fillna((train['Item_Weight'].mean()), inplace=True)
test['Item_Weight'].fillna((test['Item_Weight'].mean()), inplace=True)
### reducing fat content to only two categories

train['Item_Fat_Content'] = train['Item_Fat_Content'].replace(['low fat','LF'], ['Low Fat','Low Fat'])
train['Item_Fat_Content'] = train['Item_Fat_Content'].replace(['reg'], ['Regular'])
test['Item_Fat_Content'] = test['Item_Fat_Content'].replace(['low fat','LF'], ['Low Fat','Low Fat'])
test['Item_Fat_Content'] = test['Item_Fat_Content'].replace(['reg'], ['Regular'])
train['Outlet_Establishment_Year'] = 2013 - train['Outlet_Establishment_Year']
test['Outlet_Establishment_Year'] = 2013 - test['Outlet_Establishment_Year']

train['Outlet_Size'].fillna('Small',inplace=True)
test['Outlet_Size'].fillna('Small',inplace=True)

train['Item_Visibility'] = np.sqrt(train['Item_Visibility'])
test['Item_Visibility'] = np.sqrt(test['Item_Visibility'])

col = ['Outlet_Size','Outlet_Location_Type','Outlet_Type','Item_Fat_Content']
test['Item_Outlet_Sales'] = 0combi = train.append(test)for i in col:
 combi[i] = number.fit_transform(combi[i].astype('str'))
 combi[i] = combi[i].astype('object')
train = combi[:train.shape[0]]
test = combi[train.shape[0]:]
test.drop('Item_Outlet_Sales',axis=1,inplace=True)
## removing id variables

tpot_train = train.drop(['Outlet_Identifier','Item_Type','Item_Identifier'],axis=1)
tpot_test = test.drop(['Outlet_Identifier','Item_Type','Item_Identifier'],axis=1)
target = tpot_train['Item_Outlet_Sales']
tpot_train.drop('Item_Outlet_Sales',axis=1,inplace=True)
# finally building model using tpot library

from tpot import TPOTRegressor
X_train, X_test, y_train, y_test = train_test_split(tpot_train, target,
 train_size=0.75, test_size=0.25)

tpot = TPOTRegressor(generations=5, population_size=50, verbosity=2)
tpot.fit(X_train, y_train)
print(tpot.score(X_test, y_test))
tpot.export('tpot_boston_pipeline.py')
一旦这些代码运行完成,tpot_exported_pipeline.py 里就将会放入用于路径优化的 python 代码。我们可以发现,ExtraTreeRegressor 可以最好地解决这个问题。
## predicting using tpot optimised pipeline

tpot_pred = tpot.predict(tpot_test)
sub1 = pd.DataFrame(data=tpot_pred)
#sub1.index = np.arange(0, len(test)+1)

sub1 = sub1.rename(columns = {'0':'Item_Outlet_Sales'})
sub1['Item_Identifier'] = test['Item_Identifier']
sub1['Outlet_Identifier'] = test['Outlet_Identifier']
sub1.columns = ['Item_Outlet_Sales','Item_Identifier','Outlet_Identifier']
sub1 = sub1[['Item_Identifier','Outlet_Identifier','Item_Outlet_Sales']]
sub1.to_csv('tpot.csv',index=False)