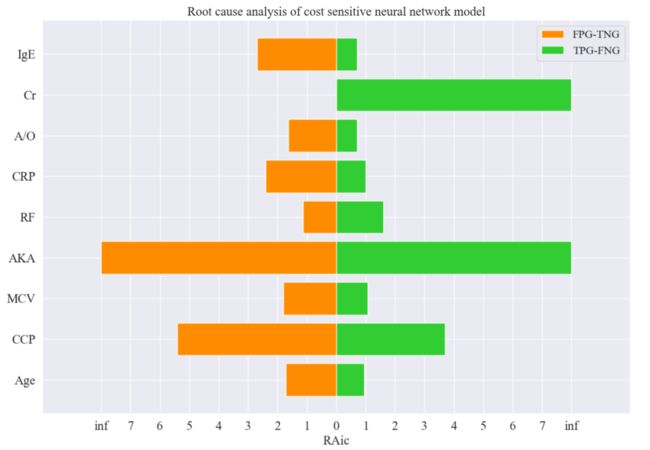
python实现绘制双向横向柱状图
实现功能:
输入:两个数组X,Y(双向)
输出:绘制双向横向柱状图
实现代码:
import numpy as np
import matplotlib.pyplot as plt
from pylab import *
import seaborn as sns

def Drawhistogram(x,y):
    font = {'family': 'Times New Roman',
            'size': 16,
            }
    sns.set(font_scale=1.2)
    plt.rc('font',family='Times New Roman')

    x = x
    y = y

    plt.figure(figsize=(12,8))
    plt.barh(range(len(y)), -x,color='darkorange',label='FPG-TNG')
    plt.barh(range(len(x)), y,color='limegreen',label='TPG-FNG')

    plt.xlim((-10,10))
    plt.xticks((-8,-7,-6,-5,-4,-3,-2,-1,0,1,2,3,4,5,6,7,8),
               ('inf','7','6','5','4','3','2','1','0','1','2','3','4','5','6','7','inf'),
               font={'size': 18})
    plt.yticks((0, 1, 2, 3, 4, 5, 6, 7, 8),
               ('Age','CCP','MCV','AKA','RF','CRP','A/O','Cr','IgE'),
               font={'size': 18})
    plt.xlabel('RAic',fontdict={'size': 18})
    plt.title("Root cause analysis of cost sensitive neural network model",
              font={'size': 18})
    plt.legend(fontsize=16)
    plt.show()

if __name__=="__main__":
    Drawhistogram(np.array([1.713,5.400,1.800,8,1.137,2.400,1.620,0.000,2.700]),
                  np.array([0.954,3.690,1.071,8,1.607,0.992,0.714,8,0.714]))
实现效果:
输入[1.713,5.400,1.800,8,1.137,2.400,1.620,0.000,2.700]和[0.954,3.690,1.071,8,1.607,0.992,0.714,8,0.714]两个数组(列表)
输出双向柱状图
喜欢记得点赞,在看,收藏,加关注(V订阅号:数据杂坛),将持续更新!
