使用LSTM实现IBM股票价格预测
一、导入第三方库
import pandas as pd
import numpy as np
import matplotlib.pyplot as plt
from sklearn.preprocessing import MinMaxScaler
from keras.models import Sequential
from keras.layers import Dense, LSTM, Dropout
from keras.optimizers import SGD
二、加载历史数据文件
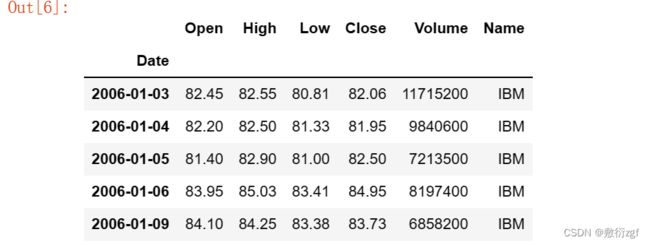
dataset = pd.read_csv("datasets_8388_11883_IBM_2006-01-01_to_2018-01-01.csv",index_col='Date',parse_dates=['Date'])
dataset.head()
dataset.shape
train_set = dataset[:'2016'].iloc[:,1:2].values
test_set = dataset['2017':].iloc[:,1:2].values
train_set.shape
test_set.shape
三、定义显示函数
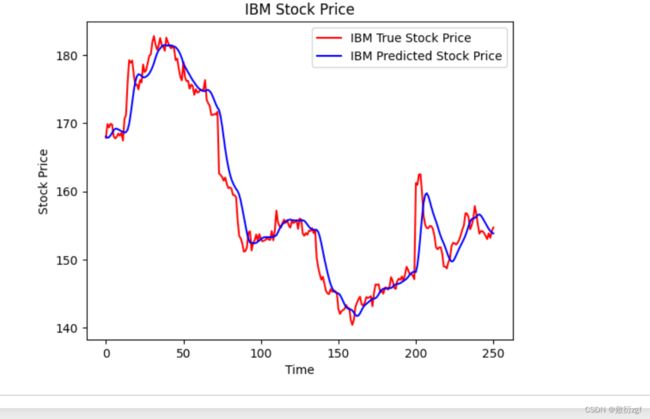
def plot_predictions(test_result, predict_result):
"""
test_result:真实值
predict_result: 预测值
"""
plt.plot(test_result,color='red',label='IBM True Stock Price')
plt.plot(predict_result,color='blue',label='IBM Predicted Stock Price')
plt.title('IBM Stock Price')
plt.xlabel('Time')
plt.ylabel('Stock Price')
plt.legend()
plt.show()
四、绘制训练集和测试集的数据
dataset['High'][:'2016'].plot(figsize=(16,4),legend=True)
dataset['High']['2017':].plot(figsize=(16,4),legend=True)
plt.title('IBM Stock Price')
plt.legend(['Train set(before 2016)','Test set(after 2017)'])
plt.show()

sc = MinMaxScaler(feature_range = [0,1])
train_set_scaled = sc.fit_transform(train_set)
X_train = []
y_train = []
for i in range(60, 2769) :
X_train.append(train_set_scaled[i-60:i,0])
y_train.append(train_set_scaled[i,0])
X_train, y_train = np.array(X_train) , np.array(y_train)
X_train.shape
X_train[0]

X_train = np.reshape(X_train,(X_train.shape[0],X_train.shape[1],1))
X_train.shape
五、搭建LSTM模型,进行训练和预测
model = Sequential()
model.add(LSTM(128,return_sequences=True,input_shape=(X_train.shape[1],1)))
model.add(Dropout(0.2))
model.add(LSTM(128,return_sequences=True))
model.add(Dropout(0.2))
model.add(LSTM(128))
model.add(Dropout(0.2))
model.add(Dense(units=1))
model.compile(optimizer='rmsprop',loss='mse')
model.fit(X_train, y_train,epochs=20,batch_size=32)

六、构建数据集,进行训练
dataset_total = pd.concat((dataset['High'][:'2016'],dataset['High']['2017':]),axis = 0)
dataset_total.shape
dataset_total

inputs = dataset_total[len(train_set):].values
inputs = inputs.reshape(-1,1)
inputs.shape
inputs_scaled = sc.fit_transform(inputs)
七、构建测试集X_test,进行股价预测
dataset_total = pd.concat((dataset['High'][:'2016'],dataset['High']['2017':]),axis=0)
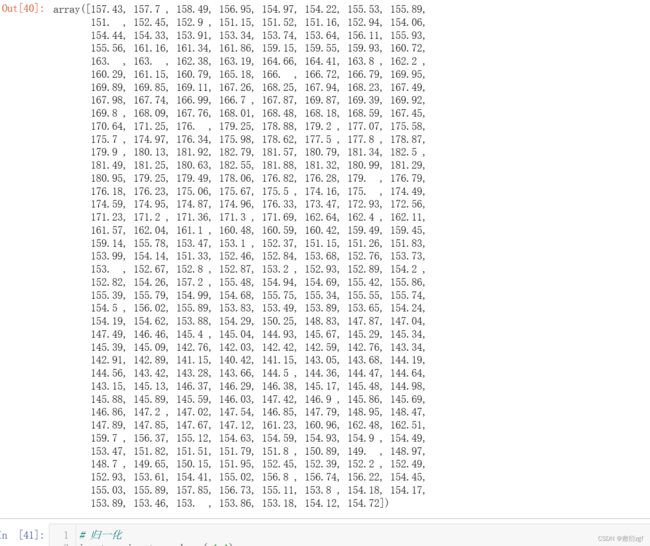
inputs = dataset_total[len(dataset_total) - len(test_set) - 60 :].values
inputs
inputs = inputs.reshape(-1,1)
inputs = sc.transform(inputs)
inputs.shape
X_test = []
for i in range(60,311):
X_test.append(inputs[i-60:i,0])
X_test = np.array(X_test)
X_test.shape
X_test = np.reshape(X_test,(X_test.shape[0],X_test.shape[1],1))
X_test.shape
predict_test = model.predict(X_test)
predict_test.shape

predict_stock_price = sc.inverse_transform(predict_test)
predict_stock_price

plot_predictions(test_set,predict_stock_price)