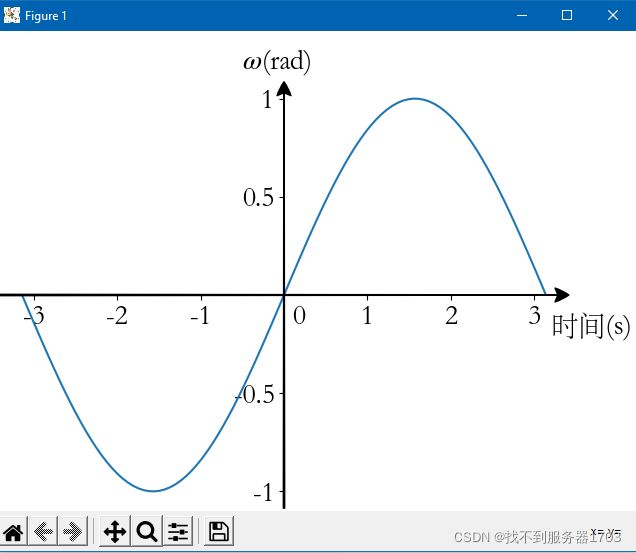
matplotlib不用axisartist画出带箭头且原点居中的坐标系的画法
import numpy as np
import matplotlib.pyplot as plt

x = np.linspace(-3.14, 3.14, 100)
y = np.sin(x)
params = {'axes.labelsize': 20, 'axes.titlesize':20, 'legend.fontsize': 20, 'xtick.labelsize': 20, 'ytick.labelsize': 20}
plt.rcParams.update(params)
fig, ax = plt.subplots()
fig.subplots_adjust(left=0.1, bottom=0.1, right=1, top=1)
ax.spines[:].set_visible(False)
# ax.spines['right'].set_color('none')
# ax.spines['top'].set_color('none')
ax.spines['bottom'].set_position(('data',0))
ax.spines['left'].set_position(('data',0))
ax.xaxis.set_ticks_position('bottom')
ax.yaxis.set_ticks_position('left')
ax.set_xticks(np.linspace(-3, 3, 7))
ax.set_yticks(np.linspace(-1, 1, 5))
ax.set_xticklabels(['-3', '-2', '-1', '', '1', '2', '3'])
ax.set_yticklabels(['-1', '-0.5', '', '0.5', '1'])
ax.text(0.1, -0.13, '0', fontsize=20)
ax.text(-0.5, 1.35, r'$\omega$(rad)', fontsize=20)
ax.text(3.14, -0.5, '时间(s)', fontsize=20)
ax.arrow(-3.5, 0, 7, 0, color='black', head_width=0.25, head_length=0.5)
ax.arrow(0, -1.1, 0, 2.2, color='black', head_width=0.25, head_length=0.5)
ax.plot(x, y)
plt.show()
需要注意的是,
ax.set_xlabel('时间(s)')
ax.set_ylabel(r'$\omega$(rad)')
ax.xaxis.set_label_coords(.9, .4)
ax.yaxis.set_label_coords(.4, .9)
直接改坐标轴名称的话,纵坐标轴的名称是竖着的而且好像没有对应的旋转的方法。ax.arrow画出来的箭头的箭尖会根据坐标轴的尺度缩放,不建议使用,用annotate代替。matplotlib的annotate的箭头类型详解。使用axisartist的方法见 matplotlib的axisartist类
import numpy as np
import matplotlib.pyplot as plt
import matplotlib.patches as mpatches

x = np.linspace(-3.14, 3.14, 100)
y = np.sin(x)
params = {'axes.labelsize': 20, 'axes.titlesize':20, 'legend.fontsize': 20, 'xtick.labelsize': 20, 'ytick.labelsize': 20}
plt.rcParams.update(params)
fig, ax = plt.subplots()
fig.subplots_adjust(left=0, bottom=0, right=0.9, top=0.9)
ax.spines[:].set_visible(False)
ax.spines['bottom'].set_position(('data',0))
ax.spines['left'].set_position(('data',0))
ax.yaxis.set_ticks_position('left')
ax.set_xticks(np.linspace(-3, 3, 7))
ax.set_yticks(np.linspace(-1, 1, 5))
ax.set_xticklabels(['-3', '-2', '-1', '', '1', '2', '3'])
ax.set_yticklabels(['-1', '-0.5', '', '0.5', '1'])
ax.set_ylim([-1.2, 1.3])
ax.text(0.1, -0.15, '0', fontsize=20)
ax.text(-0.5, 1.4, r'$\omega$(rad)', fontsize=20)
ax.text(3.2, -0.2, '时间(s)', fontsize=20)
arrowproperty = dict(facecolor='black', arrowstyle=mpatches.ArrowStyle("Fancy", head_length=1, head_width=1, tail_width=.1))
ax.annotate("", xy=(1, 0.5), xytext=(0, 0.5), xycoords='axes fraction', arrowprops=arrowproperty)
ax.annotate("", xy=(0.5, 1), xytext=(0.5, 0), xycoords='axes fraction', arrowprops=arrowproperty)
ax.plot(x, y)
plt.show()
将以上设置代码进行封装,使用时直接调用函数的代码见 封装matplotlib绘制单个子图