《吴恩达深度学习》编程作业-第二周
目录
1.题目:基于神经网络思维模式的逻辑回归
2.声明
3.知识回顾
4.Python编程分析
4.1.导入需要用的库
4.2.数据处理
4.2.1.读取数据(包括训练集和测试集)
4.2.2.取出数据(包括训练集和测试集,还有标签的值)
4.2.3.数据维度处理(设置成为合适的维度)
4.2.4.标准化数据
4.3.构建神经网络
4.3.1.定义激活函数sigmiod(z)
4.3.2.初始化参数(w、b)
4.3.3.构建正向/反向传播函数
4.3.4.构建优化函数(采用梯度下降,使用的是训练数据)
4.3.5.构建预测函数(使用的是测试数据)
4.3.6.模型整合
4.3.7.模型测试
4.3.8绘制图像(绘制成本函数图像)
4.4.比较不同学习率的cost图像
4.5.导入其他图片并且识别图片
5.完整代码
1.题目:基于神经网络思维模式的逻辑回归
在本博文中,您将构建您的图像识别算法。您将构建一个猫分类器,识别猫的准确率为70%。
随着您不断学习新技术,您将提高到猫与非猫数据集的80%以上的准确性。通过完成这项任务,你将:
-以建立与神经网络相关的方式使用逻辑回归;
-学习如何最小化成本函数;
-了解如何使用成本的导数来更新参数。
选修部分:
(1)通过改变学习率观察不同学习率下cost的图像;
(2)向模型输入自己的图片进行识别,判断猫/非猫。
2.声明
首先声明:
本文参考Kulbear在github上发表的文章《Logistic Regression with a Neural Network mindset》,博主基于Kulbear的文章和自身的理解,采用了模块化分析的方式写了本篇博客,如有不妥的地方欢迎大家指正。
本文使用的资料(数据集)已经上传的百度网盘【点击下载】,提取码:afxp,请在开始撸代码之前下载好数据集。
使用软件:Anaconda-->Jupyter-Notebook (python使用的版本是Anaconda默认的3.9)。
3.知识回顾
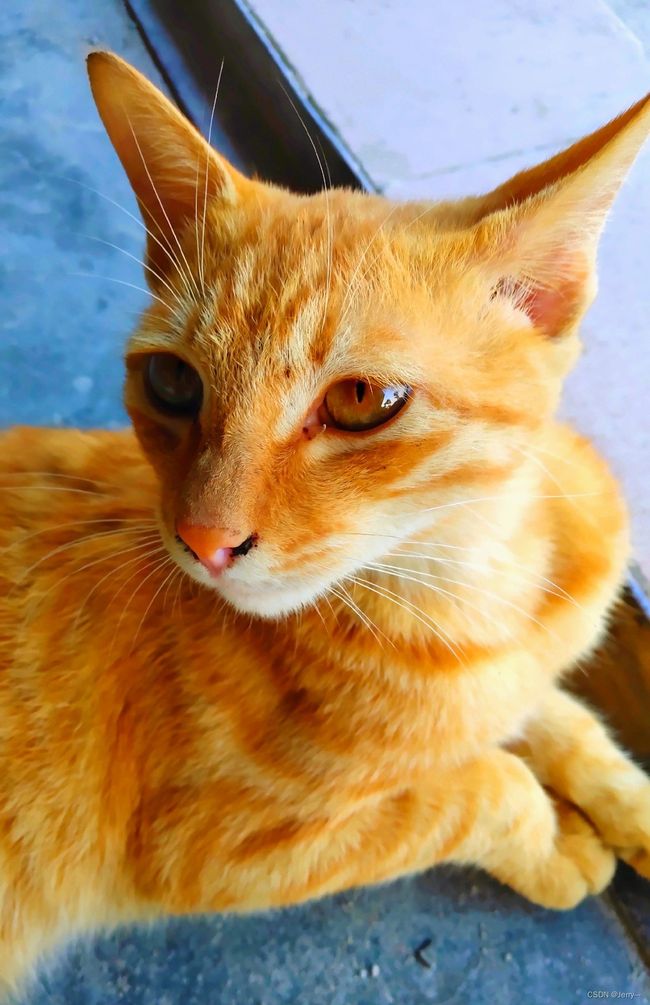
二分类问题:假如你有一张图片作为输入,比如这只猫(如图)。如果识别这张图片为猫,则输出标签为”1“作为结果;如果不是猫,则输出标签”0”作为结果(用字母y表示输出的结果标签)。
4.Python编程分析
4.1.导入需要用的库
import numpy as np
import matplotlib.pyplot as plt
import h5py
numpy:用Python进行科学计算的基本软件包;
matplotlib:用于在Python中绘制图表;
h5py:与h5文件中存储的数据集进行交互常用软件包。
4.2.数据处理
4.2.1.读取数据(包括训练集和测试集)
train_dataset=h5py.File('C:/Users/Administrator/Desktop/Homework/The_second_work/datasets/train_catvnoncat.h5','r')

test_dataset=h5py.File('C:/Users/Administrator/Desktop/Homework/The_second_work/datasets/test_catvnoncat.h5','r')
h5py.File(‘ ’,’ ’):第一个’ ’表示数据集所在的文件位置,第二个’ ’表示的是对于文件的操作是“读取”还是 “写入”,’r'表示读取、'w'表示写。
4.2.2.取出数据(包括训练集和测试集,还有标签的值)
train_set_x_orig=np.array(train_dataset['train_set_x'][:])
train_set_y_orig=np.array(train_dataset['train_set_y'][:])

classes=np.array(test_dataset['list_classes'][:])

test_set_x_orig=np.array(test_dataset['test_set_x'][:])
test_set_y_orig=np.array(test_dataset['test_set_y'][:])
[:]表示将所有的行和列取出来。
train_set_x_orig :保存的是训练集里面的图像数据,维度为(209,64,64,3)。
train_set_y_orig :保存的是训练集的图像对应的分类值(【0 | 1】:0表示不是猫,1表示是猫)。
classes : 保存的是以bytes类型保存的两个字符串数据,数据为:[b’non-cat’ b’cat’]。
test_set_x_orig :保存的是测试集里面的图像数据,维度为(50,64,64,3)。
test_set_y_orig : 保存的是测试集的图像对应的分类值(【0 | 1】,0表示不是猫,1表示是猫)。
4.2.3.数据维度处理(设置成为合适的维度)
m_train=train_set_x_orig.shape[0] #训练集样本数量
m_test=test_set_x_orig.shape[0]   #测试集样本数量

train_set_x_flatten=train_set_x_orig.reshape(m_train,-1).T
test_set_x_flatten=test_set_x_orig.reshape(m_test,-1).T

train_set_y_orig=train_set_y_orig.reshape(1,m_train)
test_set_y_orig=test_set_y_orig.reshape(1,m_test)
X集要求的维度:(n,m),n:64*64*3,m:样本数量
使用X.shape 读取可以得到X的维度为(n,m)
Y集要求的维度:(1,m),m:样本数量
使用X.shape 读取可以得到X的维度为(1,m)
维度处理的方法:
当想将形状(a,b,c,d)的矩阵X平铺成形状(b * c * d,a)的矩阵X_flatten时,可以使用以下代码:
X_flatten=X.reshape(X.shape[0],-1).T
这一段意思是指把数组变为209行的矩阵(因为训练集里有209张图片),因为懒得算列有多少,于是就用-1告诉程序帮我们算,最后程序算出来12288列,再最后用一个T表示转置,这就变成了12288行,209列,测试集亦如此。
处理X集:获取样本数量m_train、m_test,并且通过转置将X集转换为((64*64*3),209)的形式。
处理Y集: Y集的维度形式是(1,m_train)、(1,m_test)。
测试维度处理是否符合要求:
print("训练集处理后的维度:"+str(train_set_x_flatten.shape))
print("训练集_标签处理后的维度:"+str(train_set_y_orig.shape))
print("测试集处理后的维度:"+str(test_set_x_flatten.shape))
print("测试集_标签处理后的维度:"+str(test_set_y_orig.shape))
打印结果:
训练集处理后的维度:(12288, 209)
训练集_标签处理后的维度:(1, 209)
测试集处理后的维度:(12288, 50)
测试集_标签处理后的维度:(1, 50)4.2.4.标准化数据
为了表示彩色图像,必须为每个像素指定红色,绿色和蓝色通道(RGB),因此像素值实际上是从0到255范围内的三个数字的向量。
机器学习中一个常见的预处理步骤是对数据集进行居中和标准化,这意味着可以减去每个示例中整个numpy数组的平均值,然后将每个示例除以整个numpy数组的标准偏差。但对于图片数据集,它更简单,更方便,几乎可以将数据集的每一行除以255(像素通道的最大值),因为在RGB中不存在比255大的数据,所以我们可以放心的除以255,让标准化的数据位于[0,1]之间,现在标准化我们的数据集:
train_set_x=train_set_x_flatten/255
test_set_x=test_set_x_flatten/2554.3.构建神经网络
4.3.1.定义激活函数sigmiod(z)
def sigmiod(z):

    a=1/(1+np.exp(-z))

return a4.3.2.初始化参数(w、b)
def initialize_with_zeros(dim):

    w=np.zeros(shape=(dim,1))  #np.zeros((n,1))初始为全0的矩阵
    b=0

    #使用assert声明来确保我要的数据是正确的(课程上面说过)
    assert(w.shape==(dim,1))#w的维度是(dim,1)
    assert(isinstance(b,float) or isinstance(b,int))#b的类型是float或者是int

return (w,b)4.3.3.构建正向/反向传播函数
函数内部包括:前向传播、损失函数、反向传播,并且将返回值(w,b)封装在字典中。
def propagate(w,b,X,Y):

    m=X.shape[1]#样本数量

    #正向传播
    z=np.dot(w.T,X)+b
    A=sigmiod(z)#计算激活值
    J=(-1/m)*np.sum(Y*np.log(A)+(1-Y)*(np.log(1-A)))#计算成本函数

    #反向传播
    dw=(1/m)*np.dot(X,(A-Y).T)
    db=(1/m)*np.sum(A-Y)

    #使用assert声明来确保我要的数据是正确的(课程上面说过)
    assert(dw.shape==w.shape)
    assert(db.dtype==float)
    assert(J.shape==())

    J=np.squeeze(J)

    #创建一个字典,把dw,db保存起来
    grads={
            "dw":dw,
            "db":db
            }

return (grads,J) 4.3.4.构建优化函数(采用梯度下降,使用的是训练数据)
def optimize(w,b,X,Y,num_iterations,learning_rate,print_cost=False):

    costs=[]  #定义一个成本列表

    for i in range(num_iterations):

        grads,cost=propagate(w,b,X,Y)

        dw=grads["dw"]
        db=grads["db"]

        w=w-learning_rate*dw
        b=b-learning_rate*db

        #记录成本
        if i%100==0:
            costs.append(cost)    #append() 函数可以向列表末尾添加元素
        if (print_cost)and(i%100==0):
            print("迭代的次数:%i,误差值: %f" % (i,cost)) #%i表示十进制整数,%f表示浮点数
                                                         #占位符一般用法:‘str %istr’% 变量

    params={"w":w,"b":b}

    grads={"dw":dw,"db":db}

return(params,grads,costs)4.3.5.构建预测函数(使用的是测试数据)
使用学习逻辑回归参数logistic (w,b)预测标签是0还是1:
参数:
w - 权重,大小不等的数组(num_px * num_px * 3,1)
b - 偏差,一个标量
X - 维度为(num_px * num_px * 3,训练数据的数量)的数据
返回:
Y_prediction - 包含X中所有图片的所有预测【0 | 1】的一个numpy数组(向量)
def predict(w,b,X):

    m=X.shape[1] #样本数量

    Y_prediction=np.zeros((1,m)) #初始化Y集

    w=w.reshape(X.shape[0],1) #w维度处理

    #计算预测猫在图片中出现的概率
    A=sigmiod(np.dot(w.T,X)+b)

    for i in range(A.shape[1]):
        #将概率a[0,i]转换为实际预测p[0,i]
        Y_prediction[0,i]=1 if A[0,i]>0.5 else 0

    #使用assert声明
    assert(Y_prediction.shape==(1,m))

return Y_prediction4.3.6.模型整合
通过调用之前实现的函数来构建逻辑回归模型:
参数:
X_train - numpy的数组,维度为(num_px * num_px * 3,m_train)的训练集
Y_train - numpy的数组,维度为(1,m_train)(矢量)的训练标签集
X_test - numpy的数组,维度为(num_px * num_px * 3,m_test)的测试集
Y_test - numpy的数组,维度为(1,m_test)的(向量)的测试标签集
num_iterations -表示用于优化参数的迭代次数的超参数
learning_rate -表示optimize()更新规则中使用的学习速率的超参数
print_cost - 设置为true以每100次迭代打印成本
返回:
d -包含有关模型信息的字典
def model(X_train,Y_train,X_test,Y_test,num_iterations=2000,learning_rate=0.5,print_cost=False):

    w,b=initialize_with_zeros(X_train.shape[0]) #初始化参数w,b

    parameters,grads,costs=optimize(w,b,X_train,Y_train,num_iterations,learning_rate,print_cost)#梯度下降更新

    #从字典“参数”中检索w和b

    w,b=parameters["w"],parameters["b"]

    #预测测试/训练的例子
    Y_prediction_test=predict(w,b,X_test)
    Y_prediction_train=predict(w,b,X_train)

    #打印训练后的准确性
    print("训练集准确性:",format(100-np.mean(np.abs(Y_prediction_train-Y_train))*100),"%")
    print("测试集准确性:",format(100-np.mean(np.abs(Y_prediction_test-Y_test))*100),"%")

    d={
        "costs":costs,
        "Y_prediction_train":Y_prediction_train,
        "Y_prediction_test":Y_prediction_test,
        "w":w,
        "b":b,
        "learning_rate":learning_rate,
        "num_iterations":num_iterations
    }

    return d
到这里训练模型已经建立好了,下面对模型进行测试。
4.3.7.模型测试
#测试model
print("====================测试model========================")
#这里加载的是真实的数据,请参见上面的代码部分
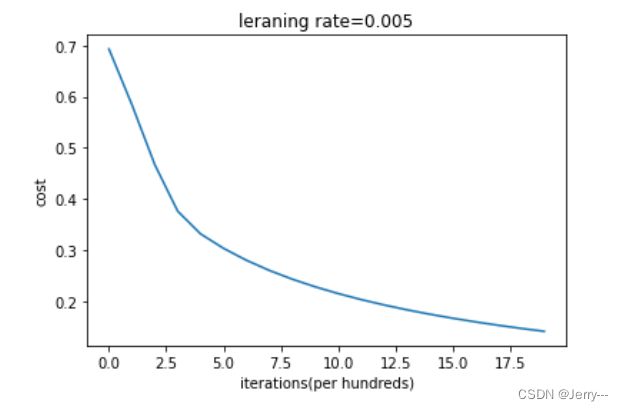
d = model(train_set_x, train_set_y_orig, test_set_x, test_set_y_orig, num_iterations = 2000, learning_rate = 0.005, print_cost = True)
测试结果:
====================测试model========================
迭代的次数:0,误差值: 0.693147
迭代的次数:100,误差值: 0.584508
迭代的次数:200,误差值: 0.466949
迭代的次数:300,误差值: 0.376007
迭代的次数:400,误差值: 0.331463
迭代的次数:500,误差值: 0.303273
迭代的次数:600,误差值: 0.279880
迭代的次数:700,误差值: 0.260042
迭代的次数:800,误差值: 0.242941
迭代的次数:900,误差值: 0.228004
迭代的次数:1000,误差值: 0.214820
迭代的次数:1100,误差值: 0.203078
迭代的次数:1200,误差值: 0.192544
迭代的次数:1300,误差值: 0.183033
迭代的次数:1400,误差值: 0.174399
迭代的次数:1500,误差值: 0.166521
迭代的次数:1600,误差值: 0.159305
迭代的次数:1700,误差值: 0.152667
迭代的次数:1800,误差值: 0.146542
迭代的次数:1900,误差值: 0.140872
训练集准确性: 99.04306220095694 %
测试集准确性: 70.0 %4.3.8绘制图像(绘制成本函数图像)
#绘制图片
costs=np.squeeze(d["costs"])
plt.plot(costs)
plt.ylabel('cost')
plt.xlabel('iterations(per hundreds)')
plt.title("leraning rate="+str(d["learning_rate"]))
plt.show()4.4.比较不同学习率的cost图像
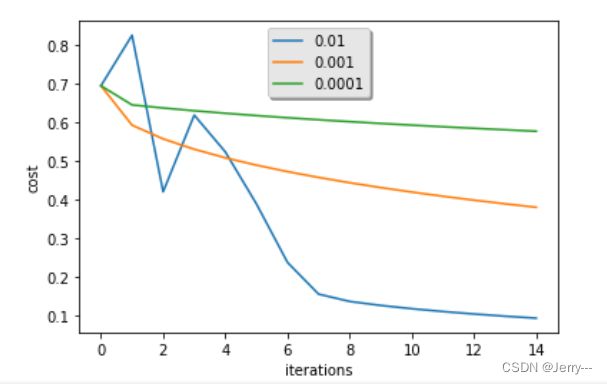
learning_rates=[0.01,0.001,0.0001]
models={}
for i in learning_rates:
    print("learning rate is :"+str(i))
    models[str(i)]=model(train_set_x, train_set_y_orig, test_set_x, test_set_y_orig, num_iterations = 1500, learning_rate = i, print_cost = False)
    print('\n'+"----------------------------------------------------------")

for i in learning_rates:
    plt.plot(np.squeeze(models[str(i)]["costs"]),label=str(models[str(i)]["learning_rate"]))

plt.ylabel('cost')
plt.xlabel('iterations')

legend=plt.legend(loc='upper center',shadow=True) #plt.pegend()设置图例的位置-loc,是否有阴影shadow=True-有
frame=legend.get_frame()
frame.set_facecolor('0.90')# #设置图例legend背景透明度为0.90
plt.show()
打印结果如下:
learning rate is :0.01
训练集准确性: 99.52153110047847 %
测试集准确性: 68.0 %

----------------------------------------------------------
learning rate is :0.001
训练集准确性: 88.99521531100478 %
测试集准确性: 64.0 %

----------------------------------------------------------
learning rate is :0.0001
训练集准确性: 68.42105263157895 %
测试集准确性: 36.0 %

----------------------------------------------------------4.5.导入其他图片并且识别图片
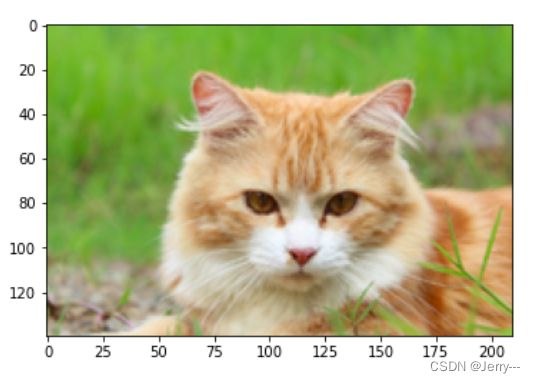
fname='C:/Users/Administrator/Pictures/Saved Pictures/10.jpg'#图片文件的位置
image=plt.imread(fname)     #读图片
plt.imshow(image)           #打印图片

from skimage import transform   #导入skimage库中的transform进行下面的变换
image_tran=transform.resize(image,(64,64,3)).reshape(64*64*3,1)#通过transform.resize(image,output_shape)裁剪图片
                                                               #image:需要修改尺寸的图片,output_shap:图片新的尺寸
                                                               #图片格式转换为(64x64x3,1)

my_predicted_image = predict(d["w"], d["b"],image_tran)

#使用np.squeeze的目的是压缩维度,【未压缩】train_set_y[:,index]的值为[1] , 【压缩后】np.squeeze(train_set_y[:,index])的值为
#只有压缩后的值才能进行解码操作soclasses中必须使用np.squeeze进行压缩处理
#decode()方法的语法:
#str.decode(encoding='UTF-8',errors='strict')

print("y="+str(np.squeeze(my_predicted_image))+",it is a "+classes[int(np.squeeze(my_predicted_image))].decode("utf-8")+" picture")
打印图片:
识别结果:
y=1.0,it is a cat picture
5.完整代码
直接使用完整代码的朋友,记得修改好文件的位置哦!!!
#一、导入需要用的库
import numpy as np
import matplotlib.pyplot as plt
import h5py

#二、数据处理
#1.读取数据(包括训练集和测试集)‘r'表示读取、'w'表示写

train_dataset=h5py.File('C:/Users/Administrator/Desktop/Homework/The_second_work/datasets/train_catvnoncat.h5','r')

test_dataset=h5py.File('C:/Users/Administrator/Desktop/Homework/The_second_work/datasets/test_catvnoncat.h5','r')

#2.取出数据(包括训练集和测试集)[:]表示将所有的行和列取出来

train_set_x_orig=np.array(train_dataset['train_set_x'][:])
train_set_y_orig=np.array(train_dataset['train_set_y'][:])

classes=np.array(test_dataset['list_classes'][:])

test_set_x_orig=np.array(test_dataset['test_set_x'][:])
test_set_y_orig=np.array(test_dataset['test_set_y'][:])

#3.数据维度处理(设置成为合适的维度)
"""
当你想将形状(a,b,c,d)的矩阵X平铺成形状(b * c * d,a)的矩阵X_flatten时,可以使用以下代码:
                  X_flatten=X.reshape(X.shape[0],-1).T
    这一段意思是指把数组变为209行的矩阵(因为训练集里有209张图片),但是我懒得算列有多少,于是我就用-1告诉程序帮我算,
    最后程序算出来时12288列,我再最后用一个T表示转置,这就变成了12288行,209列,测试集亦如此。
处理X集:
        获取样本数量m_train、m_test,并且通过转置将X集转换为((64*64*3),209)的形式
处理Y集:
        Y集的维度形式是(1,样本数量)
"""
m_train=train_set_x_orig.shape[0] #训练集样本数量
m_test=test_set_x_orig.shape[0]   #测试集样本数量

train_set_x_flatten=train_set_x_orig.reshape(m_train,-1).T
test_set_x_flatten=test_set_x_orig.reshape(m_test,-1).T

train_set_y_orig=train_set_y_orig.reshape(1,m_train)
test_set_y_orig=test_set_y_orig.reshape(1,m_test)

#4.标准化数据
"""
    为了表示彩色图像,必须为每个像素指定红色,绿色和蓝色通道(RGB),因此像素值实际上是从0到255范围内的三个数字的向量。
    机器学习中一个常见的预处理步骤是对数据集进行居中和标准化,这意味着可以减去每个示例中整个numpy数组的平均值,
    然后将每个示例除以整个numpy数组的标准偏差。但对于图片数据集,它更简单,更方便,几乎可以将数据集的每一行除以255(像素通道的最大值),
    因为在RGB中不存在比255大的数据,所以我们可以放心的除以255,让标准化的数据位于[0,1]之间,现在标准化我们的数据集:
"""
train_set_x=train_set_x_flatten/255
test_set_x=test_set_x_flatten/255

#三、构建神经网络
"""
主要步骤:
        1.计算损失函数(正向传播)
        2.计算当前梯度(反向传播)
        3.更新参数(梯度下降)
"""
#1.定义激活函数sigmiod(z)
def sigmiod(z):

    a=1/(1+np.exp(-z))

    return a

#2.初始化参数w、b
"""
    此函数为w创建一个维度为(dim,1)的0向量,并且将b初始化为0
    参数;
        dim-我们想要的矢量的大小(或者这种情况下的参数数量)
    返回:
         w  - 维度为(dim,1)的初始化向量。
         b  - 初始化的标量(对应于偏差)
"""
def initialize_with_zeros(dim):

    w=np.zeros(shape=(dim,1))  #np.zeros((n,1))初始为全0的矩阵
    b=0

    #使用assert声明来确保我要的数据是正确的(课程上面说过)
    assert(w.shape==(dim,1))#w的维度是(dim,1)
    assert(isinstance(b,float) or isinstance(b,int))#b的类型是float或者是int

    return (w,b)

#3.构建正向/反向传播函数(函数内部包括:前向传播、损失函数、反向传播,并且将返回值(w,b)封装在字典中)
"""
    实现前向和后向传播的成本函数及其梯度。
    参数:
        w  - 权重,大小不等的数组(num_px * num_px * 3,1)
        b  - 偏差,一个标量
        X  - 矩阵类型为(num_px * num_px * 3,训练数量)
        Y  - 真正的“标签”矢量(如果非猫则为0,如果是猫则为1),矩阵维度为(1,训练数据数量)

    返回:
        cost- 逻辑回归的负对数似然成本
        dw  - 相对于w的损失梯度,因此与w相同的形状
        db  - 相对于b的损失梯度,因此与b的形状相同

    利用np.squeeze()函数将表示向量的数组转换为秩为1的数组,
    这样利用matplotlib库函数画图时,就可以正常的显示结果了,否则不行。
"""
def propagate(w,b,X,Y):

    m=X.shape[1]#样本数量

    #正向传播
    z=np.dot(w.T,X)+b
    A=sigmiod(z)#计算激活值
    J=(-1/m)*np.sum(Y*np.log(A)+(1-Y)*(np.log(1-A)))#计算成本函数

    #反向传播
    dw=(1/m)*np.dot(X,(A-Y).T)
    db=(1/m)*np.sum(A-Y)

    #使用assert声明来确保我要的数据是正确的(课程上面说过)
    assert(dw.shape==w.shape)
    assert(db.dtype==float)
    assert(J.shape==())

    J=np.squeeze(J)

    #创建一个字典,把dw,db保存起来
    grads={
            "dw":dw,
            "db":db
            }
    return (grads,J)

#4.构建优化函数(采用梯度下降函数)(使用的是训练数据)
"""
    此函数通过运行梯度下降算法来优化w和b

    参数:
        w  - 权重,大小不等的数组(num_px * num_px * 3,1)
        b  - 偏差,一个标量
        X  - 维度为(num_px * num_px * 3,训练数据的数量)的数组。
        Y  - 真正的“标签”矢量(如果非猫则为0,如果是猫则为1),矩阵维度为(1,训练数据的数量)
        num_iterations  - 优化循环的迭代次数
        learning_rate  - 梯度下降更新规则的学习率
        print_cost  - 每100步打印一次损失值

    返回:
        params  - 包含权重w和偏差b的字典
        grads  - 包含权重和偏差相对于成本函数的梯度的字典
        成本 - 优化期间计算的所有成本列表,将用于绘制学习曲线。

    提示:
    我们需要写下两个步骤并遍历它们:
        1)计算当前参数的成本和梯度,使用propagate()。
        2)使用w和b的梯度下降法则更新参数。
"""
def optimize(w,b,X,Y,num_iterations,learning_rate,print_cost=False):

    costs=[]  #定义一个成本列表

    for i in range(num_iterations):

        grads,cost=propagate(w,b,X,Y)

        dw=grads["dw"]
        db=grads["db"]

        w=w-learning_rate*dw
        b=b-learning_rate*db

        #记录成本
        if i%100==0:
            costs.append(cost)    #append() 函数可以向列表末尾添加元素
        if (print_cost)and(i%100==0):
            print("迭代的次数:%i,误差值: %f" % (i,cost)) #%i表示十进制整数,%f表示浮点数
                                                         #占位符一般用法:‘str %i str’% 变量

    params={"w":w,"b":b}

    grads={"dw":dw,"db":db}

    return(params,grads,costs)

#5.构建预测函数(使用的是测试数据)
"""
    使用学习逻辑回归参数logistic (w,b)预测标签是0还是1,

    参数:
        w  - 权重,大小不等的数组(num_px * num_px * 3,1)
        b  - 偏差,一个标量
        X  - 维度为(num_px * num_px * 3,训练数据的数量)的数据

    返回:
        Y_prediction  - 包含X中所有图片的所有预测【0 | 1】的一个numpy数组(向量)

"""
def predict(w,b,X):

    m=X.shape[1] #样本数量

    Y_prediction=np.zeros((1,m)) #初始化Y集

    w=w.reshape(X.shape[0],1) #w维度处理

    #计算预测猫在图片中出现的概率
    A=sigmiod(np.dot(w.T,X)+b)

    for i in range(A.shape[1]):
        #将概率a[0,i]转换为实际预测p[0,i]
        Y_prediction[0,i]=1 if A[0,i]>0.5 else 0

    #使用assert声明
    assert(Y_prediction.shape==(1,m))

    return Y_prediction

#6.模型整合(整合2~5步骤)
"""
    通过调用之前实现的函数来构建逻辑回归模型

    参数:
        X_train  - numpy的数组,维度为(num_px * num_px * 3,m_train)的训练集
        Y_train  - numpy的数组,维度为(1,m_train)(矢量)的训练标签集
        X_test   - numpy的数组,维度为(num_px * num_px * 3,m_test)的测试集
        Y_test   - numpy的数组,维度为(1,m_test)的(向量)的测试标签集
        num_iterations  - 表示用于优化参数的迭代次数的超参数
        learning_rate  - 表示optimize()更新规则中使用的学习速率的超参数
        print_cost  - 设置为true以每100次迭代打印成本

    返回:
        d  - 包含有关模型信息的字典。
"""
def model(X_train,Y_train,X_test,Y_test,num_iterations=2000,learning_rate=0.5,print_cost=False):

    w,b=initialize_with_zeros(X_train.shape[0]) #初始化参数w,b

    parameters,grads,costs=optimize(w,b,X_train,Y_train,num_iterations,learning_rate,print_cost)#梯度下降更新

    #从字典“参数”中检索w和b

    w,b=parameters["w"],parameters["b"]

    #预测测试/训练的例子
    Y_prediction_test=predict(w,b,X_test)
    Y_prediction_train=predict(w,b,X_train)

    #打印训练后的准确性
    print("训练集准确性:",format(100-np.mean(np.abs(Y_prediction_train-Y_train))*100),"%")
    print("测试集准确性:",format(100-np.mean(np.abs(Y_prediction_test-Y_test))*100),"%")

    d={
        "costs":costs,
        "Y_prediction_train":Y_prediction_train,
        "Y_prediction_test":Y_prediction_test,
        "w":w,
        "b":b,
        "learning_rate":learning_rate,
        "num_iterations":num_iterations
    }

    return d


#7.模型测试
#测试model
print("====================测试model========================")
#这里加载的是真实的数据,请参见上面的代码部分
d = model(train_set_x, train_set_y_orig, test_set_x, test_set_y_orig, num_iterations = 2000, learning_rate = 0.005, print_cost = True)

#8.绘制图像(绘制成本函数)
#绘制图片
costs=np.squeeze(d["costs"])
plt.plot(costs)
plt.ylabel('cost')
plt.xlabel('iterations(per hundreds)')
plt.title("leraning rate="+str(d["learning_rate"]))
plt.show()


#四.比较不同学习率的cost图像
#通过打印不同学习率观察cost图像
learning_rates=[0.01,0.001,0.0001]
models={}
for i in learning_rates:
    print("learning rate is :"+str(i))
    models[str(i)]=model(train_set_x, train_set_y_orig, test_set_x, test_set_y_orig, num_iterations = 1500, learning_rate = i, print_cost = False)
    print('\n'+"----------------------------------------------------------")

for i in learning_rates:
    plt.plot(np.squeeze(models[str(i)]["costs"]),label=str(models[str(i)]["learning_rate"]))

plt.ylabel('cost')
plt.xlabel('iterations')

legend=plt.legend(loc='upper center',shadow=True) #plt.pegend()设置图例的位置-loc,是否有阴影shadow=True-有
frame=legend.get_frame()
frame.set_facecolor('0.90')# #设置图例legend背景透明度为0.90
plt.show()


#根据自己的图片进行识别-猫/非猫
fname='C:/Users/Administrator/Pictures/Saved Pictures/10.jpg'#图片文件的位置
image=plt.imread(fname)     #读图片
plt.imshow(image)           #打印图片

from skimage import transform   #导入skimage库中的transform进行下面的变换
image_tran=transform.resize(image,(64,64,3)).reshape(64*64*3,1)#通过transform.resize(image,output_shape)裁剪图片
                                                               #image:需要修改尺寸的图片,output_shap:图片新的尺寸
                                                               #图片格式转换为(64x64x3,1)

my_predicted_image = predict(d["w"], d["b"],image_tran)

#使用np.squeeze的目的是压缩维度,【未压缩】train_set_y[:,index]的值为[1] , 【压缩后】np.squeeze(train_set_y[:,index])的值为
#只有压缩后的值才能进行解码操作soclasses中必须使用np.squeeze进行压缩处理
#decode()方法的语法:
#str.decode(encoding='UTF-8',errors='strict')

print("y="+str(np.squeeze(my_predicted_image))+",it is a "+classes[int(np.squeeze(my_predicted_image))].decode("utf-8")+" picture")


