鸢尾花分类_Python学习之knn实现鸢尾花分类
# K近邻算法

# 导入相关库文件
import numpy as np
import matplotlib.pyplot as plt
#import pandas as pd
from sklearn import neighbors, datasets

# 导入数据集,数据集sklearn自带,X与y一一对应
dataset = datasets.load_iris()
# 获取鸢尾花前两列花萼长度和花萼宽度(sepal_length、sepal_width)数据作为X
X = dataset.data[:, :2]
# 获取鸢尾花种类作为Y
# 2表示Iris-virginica,1表示Iris-versicolor,0表示Iris-setosa
y = dataset.target

# 这里没有进行特征缩放,是因为X属于一个都在一个较小的区间,所以无需进行特征缩放(已经达到特征缩放后的要求,观察数据很重要)
attributes_dict = {0:"sepal_length",1:"sepal_width"}
for attribute in attributes_dict:
    print("{} 最大值:{}".format(attributes_dict[attribute], np.max(X[:,attribute])))
    print("{} 最小值:{}".format(attributes_dict[attribute], np.min(X[:,attribute])))
    # round 函数将float数据格式化小数点后一位
    print("{} 平均值:{}".format(attributes_dict[attribute], round(np.average(X[:, attribute]),1)))
    print("-------------------------------------")

# 划分数据为训练集和测试集
from sklearn.model_selection import train_test_split
"""
    train_test_split(train_data,train_target,test_size=0.4, random_state=0,stratify=y_train)
    Parameters:
        train_data:所要划分的样本特征集
        train_target:所要划分的样本结果
        test_size:样本占比,如果是整数的话就是样本的数量
        random_state:是随机数的种子。
        随机数种子:其实就是该组随机数的编号,在需要重复试验的时候,保证得到一组一样的随机数。
        比如你每次都填1,其他参数一样的情况下你得到的随机数组是一样的。
        但填0或不填,每次都会不一样。
"""
# train_test_split返回四个参数
X_train, X_test, y_train, y_test = train_test_split(X, y, test_size = 0.25, random_state = 0)

# 使用训练集训练KNN
from sklearn.neighbors import KNeighborsClassifier
'''
        class KNeighborsClassifier(NeighborsBase, KNeighborsMixin,
                                    SupervisedIntegerMixin, ClassifierMixin):
            Parameters:
                n_neighbors:   默认邻居的数量
                weights:      权重
                    可选参数
                    uniform:    统一的权重. 在每一个邻居区域里的点的权重都是一样的。
                    distance:   权重点等于他们距离的倒数。使用此函数,更近的邻居对于所预测的点的影响更大
                    [callable]: 一个用户自定义的方法,此方法接收一个距离的数组,然后返回一个相同形状并且包含权重的数组。
                algorithm:    采用的算法
                    可选参数
                     ball_tree: 使用算法 BallTree
                     kd_tree:   使用算法 KDTree
                     brute:     使用暴力搜索
                     auto:      会基于传入fit方法的内容,选择最合适的算法。
                p:              距离度量的类型
                metric:        树的距离矩阵
                metric_params: 矩阵参数
                n_jobs:        用于搜索邻居,可并行运行的任务数量
'''
# p=2表示选取欧式距离
classifier = KNeighborsClassifier(n_neighbors = 5, metric = 'minkowski', p = 2)
classifier.fit(X_train, y_train)  #knn无训练过程,只是做数据保存到内存

# 预测测试集结果
y_pred = classifier.predict(X_test)

# 创建混淆矩阵
from sklearn.metrics import confusion_matrix
"""
    def confusion_matrix(y_true, y_pred, labels=None, sample_weight=None):
        Parameters:
             y_true:       样本真实分类结果
             y_pred:       样本预测分类结果
             labels:       给出的类别
             sample_weigh: 样本权重

"""
# 所有正确预测的结果都在对角线上,非对角线上的值为预测错误数量
cm = confusion_matrix(y_test, y_pred)
print('cm',cm)
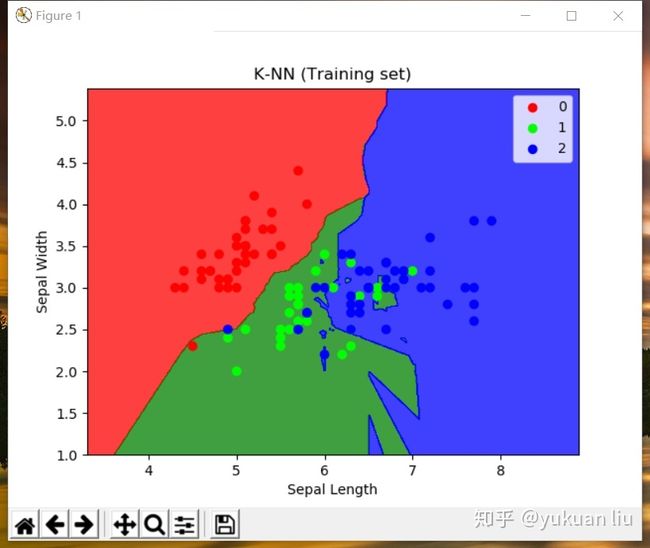
# 可视化训练集结果
from matplotlib.colors import ListedColormap
X_set, y_set = X_train, y_train
# meshgrid函数用两个坐标轴上的点在平面上画网格。
# X1,X2为坐标矩阵,用来画网格
X1, X2 = np.meshgrid(np.arange(start = X_set[:, 0].min() - 1, stop = X_set[:, 0].max() + 1, step = 0.01),
                     np.arange(start = X_set[:, 1].min() - 1, stop = X_set[:, 1].max() + 1, step = 0.01))
# 绘制二维等高线
# 在网格的基础上添加高度值
plt.contourf(X1, X2, classifier.predict(np.array([X1.ravel(), X2.ravel()]).T).reshape(X1.shape),
             alpha = 0.75, cmap = ListedColormap(('red', 'green', 'blue')))
plt.xlim(X1.min(), X1.max())
plt.ylim(X2.min(), X2.max())
for i, j in enumerate(np.unique(y_set)):
    # 绘制散点图
    # 自matplotlib 3.0.3 之后,scatter的c参数接收的数据类型为numpy的二维数组
    # 这里的color_list,有三种类别的点,采用红、绿、蓝、三种颜色辨识
    # 数组内容为rgb数组
    color_list = [[[1,0,0],[0,1,0],[0,0,1]][i]]
    # 使用掩码方法获取所有类别为0、1、2的数据点个数
    count = np.sum((y_set == j)==True)
    # 通过掩码的方式从X_set中获取当类别为0、1、2时的x坐标和y坐标
    '''
        plt.scatter(x, y, c, marker, cmap,
                                alpha, linewidths, edgecolors):
            Parameters:
                x, y:   数据的坐标
                c:      颜色,颜色序列
                marker: 绘制数据点的形状,默认是点
                cmap:  atplotlib.colors.Colormap 内置的颜色序列
                alpha:  绘制数据点的透明度范围是[0-1] 0到1表示完全透明到完全不透明
                linewidths:   数据点形状的边框粗细
                edgecolors :  数据点形状的边框颜色
    '''
    plt.scatter(X_set[y_set == j, 0], X_set[y_set == j, 1],
            c = color_list*count, label = j)

plt.title('K-NN (Training set)')
plt.xlabel('Sepal Length')
plt.ylabel('Sepal Width')
plt.legend()
plt.show()

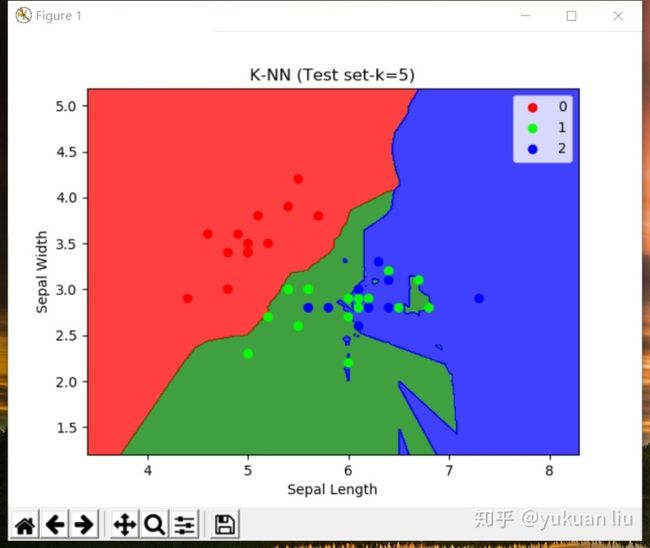
# 可视化测试集结果
from matplotlib.colors import ListedColormap
# meshgrid函数用两个坐标轴上的点在平面上画网格。
# X1,X2为坐标矩阵,用来画网格
X_set, y_set = X_test, y_test
X1, X2 = np.meshgrid(np.arange(start = X_set[:, 0].min() - 1, stop = X_set[:, 0].max() + 1, step = 0.01),
                     np.arange(start = X_set[:, 1].min() - 1, stop = X_set[:, 1].max() + 1, step = 0.01))
# 绘制二维等高线
# 在网格的基础上添加高度值
plt.contourf(X1, X2, classifier.predict(np.array([X1.ravel(), X2.ravel()]).T).reshape(X1.shape),
             alpha = 0.75, cmap = ListedColormap(('red', 'green', 'blue')))
plt.xlim(X1.min(), X1.max())
plt.ylim(X2.min(), X2.max())
for i, j in enumerate(np.unique(y_set)):
    # 绘制散点图
    # 自matplotlib 3.0.3 之后,scatter的c参数接收的数据类型为numpy的二维数组
    # 这里的color_list,有三种类别的点,采用红、绿、蓝、三种颜色辨识
    # 数组内容为rgb数组
    color_list = [[[1,0,0],[0,1,0],[0,0,1]][i]]
    # 使用掩码方法获取所有类别为0、1、2的数据点个数
    count = np.sum((y_set == j)==True)
    # 通过掩码的方式从X_set中获取当类别为0、1、2时的x坐标和y坐标
    '''
        plt.scatter(x, y, c, marker, cmap,
                                alpha, linewidths, edgecolors):
            Parameters:
                x, y:   数据的坐标
                c:      颜色,颜色序列
                marker: 绘制数据点的形状,默认是点
                cmap:  atplotlib.colors.Colormap 内置的颜色序列
                alpha:  绘制数据点的透明度范围是[0-1] 0到1表示完全透明到完全不透明
                linewidths:   数据点形状的边框粗细
                edgecolors :  数据点形状的边框颜色
    '''
    plt.scatter(X_set[y_set == j, 0], X_set[y_set == j, 1],
                c = color_list*count, label = j)
plt.title('K-NN (Test set-k=5)')
plt.xlabel('Sepal Length')
plt.ylabel('Sepal Width')
plt.legend()
plt.show()
输出:
sepal_length 最大值:7.9
sepal_length 最小值:4.3
sepal_length 平均值:5.8
-------------------------------------
sepal_width 最大值:4.4
sepal_width 最小值:2.0
sepal_width 平均值:3.1
-------------------------------------
cm [[13 0 0]
[ 0 9 7]
[ 0 2 7]]
训练集结果可视化:
测试集结果可视化:


