吴恩达Coursera深度学习(1-3)编程练习
练习部分解释:跟网上大多数博客都不一样,因为之前我已经在notebook上做完了,再总结一遍放在博客上。
Class 1:神经网络和深度学习
Week 3:浅层神经网络——编程练习
目录
- Class 1神经网络和深度学习
- Week 3浅层神经网络编程练习
- 目录
- 1数据集
- 2简单线性逻辑回归模型
- 3神经网络模型
1、数据集
- planar_utils.py
import matplotlib.pyplot as plt
import numpy as np
import sklearn
import sklearn.datasets
import sklearn.linear_model

def sigmoid(x):
    s = 1/(1+np.exp(-x))
    return s

def load_planar_dataset():
    np.random.seed(1)
    m = 400              # 样本总数
    N = int(m/2)         # 每类样本数
    D = 2                # 维度
    X = np.zeros((m,D))  # 初始化,每行是一个样本
    Y = np.zeros((m,1), dtype='uint8') # 标签 (0 for red, 1 for blue)
    a = 4                # 花的最大长达

    for j in range(2):
        ix = range(N*j,N*(j+1))
        t = np.linspace(j*3.12,(j+1)*3.12,N) + np.random.randn(N)*0.2  # theta
        r = a*np.sin(4*t) + np.random.randn(N)*0.2   # radius
        X[ix] = np.c_[r*np.sin(t), r*np.cos(t)]
        Y[ix] = j

    X = X.T
    Y = Y.T

    return X, Y

def setcolor(x):
    color=[]
    for i in range(x.shape[1]):
        if x[:,i]==1:
            color.append('b')
        else:
            color.append('r')
    return color

def load_extra_datasets():
    N = 200
    noisy_circles = sklearn.datasets.make_circles(n_samples=N, factor=.5, noise=.3)
    noisy_moons = sklearn.datasets.make_moons(n_samples=N, noise=.2)
    blobs = sklearn.datasets.make_blobs(n_samples=N, random_state=5, n_features=2, centers=6)
    gaussian_quantiles = sklearn.datasets.make_gaussian_quantiles(mean=None, cov=0.5, n_samples=N, n_features=2, n_classes=2, shuffle=True, random_state=None)
    no_structure = np.random.rand(N, 2), np.random.rand(N, 2)

    return noisy_circles, noisy_moons, blobs, gaussian_quantiles, no_structure

def plot_decision_boundary(model, X, y):

    # 设置数据的边界,并向外扩充一点
    x_min, x_max = X[0, :].min() - 1, X[0, :].max() + 1
    y_min, y_max = X[1, :].min() - 1, X[1, :].max() + 1
    h = 0.01

    # 生成以 h 为步长的格子
    xx, yy = np.meshgrid(np.arange(x_min, x_max, h), np.arange(y_min, y_max, h))

    # Predict the function value for the whole grid
    # ravel()与flatten()都是平铺
    # np.r_按行组合array,np.c_按列组合array
    Z = model(np.c_[xx.ravel(), yy.ravel()])
    Z = Z.reshape(xx.shape)

    # Plot the contour and training examples
    # contourf(x,y,f(x,y),alpha=0.75,cmap='jet')
    plt.contourf(xx, yy, Z, cmap=plt.cm.Spectral)
    plt.ylabel('x2')
    plt.xlabel('x1')
    color = setcolor(y)
    plt.scatter(X[0, :], X[1, :], c=color, cmap=plt.cm.Spectral)

if __name__=="__main__":
    X,Y = load_planar_dataset()
    print(X.shape,Y.shape)
    color =setcolor(Y)

    # 显示花
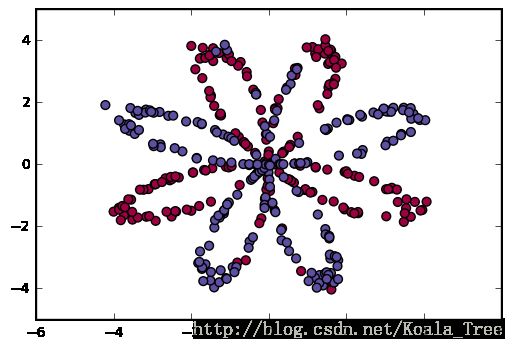
    plt.scatter(X[0,:],X[1,:],s=20,c=color,cmap=plt.cm.Spectral)
    #plt.show()
(2, 400) (1, 400)2、简单线性逻辑回归模型
import numpy as np
import matplotlib.pyplot as plt
import sklearn
import sklearn.datasets
import sklearn.linear_model
from testCases import *
from planar_utils import sigmoid,plot_decision_boundary,load_planar_dataset,load_extra_datasets

# 1、下载数据集
np.random.seed(1)   # 设定一个种子,保证结果的一致性
X,Y = load_planar_dataset()

shape_x = X.shape
shape_y = Y.shape
m = X.shape[1]     #训练集大小
print(shape_x,shape_y,m)

# 2、简单的逻辑回归
# 训练逻辑回归分类器
clf = sklearn.linear_model.LogisticRegressionCV()  #创建分类器对象
clf.fit(X.T,Y.T)                                   #用训练数据拟合分类器模型

# 画逻辑回归的分界线
plot_decision_boundary(lambda x: clf.predict(x), X, Y)   #用训练好的分类器去预测新数据
plt.title("Logistic Regression")
plt.show()

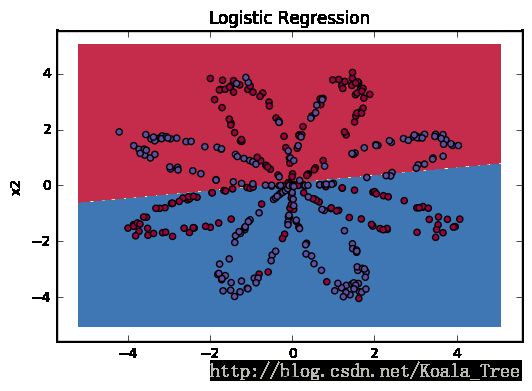
# 预测正确率,数据集不是线性可分的,所以逻辑回归表现不好
LR_predictions = clf.predict(X.T)
print(Y.shape,LR_predictions.shape)
LR_accuracy = (np.dot(Y,LR_predictions)+np.dot(1-Y,1-LR_predictions))/Y.size*100
print ('Accuracy of logistic regression: %d' % LR_accuracy +'%')
(1, 400) (400,)
Accuracy of logistic regression: 47%3、神经网络模型
import numpy as np
import matplotlib.pyplot as plt
import sklearn
import sklearn.datasets
import sklearn.linear_model
from testCases import *
from planar_utils import sigmoid,plot_decision_boundary,load_planar_dataset,load_extra_datasets

# 下载额外的数据集
np.random.seed(1)   # 设定一个种子,保证结果的一致性

noisy_circles, noisy_moons, blobs, gaussian_quantiles, no_structure = load_extra_datasets()
datasets = {"noisy_circles": noisy_circles,
            "noisy_moons": noisy_moons,
            "blobs": blobs,
            "gaussian_quantiles": gaussian_quantiles}

dataset = "blobs"
X,Y = datasets[dataset]
X,Y = X.T,Y.reshape(1,Y.shape[0])

if dataset == "blobs":
    Y = Y % 2
print(X.shape, Y.shape, X.shape[1])

def setcolor(Y):
    color=[]
    for i in range(Y.shape[1]):
        if Y[:,i]==1:
            color.append('b')
        else:
            color.append('r')
    return color

#显示数据
plt.scatter(X[0,:], X[1:], s=30, c=setcolor(Y), cmap=plt.cm.Spectral)
plt.show() #加上才显示


# 3、神经网络模型
# 3-1 定义三层网络结构
def layer_sizes(X,Y):
    n_x = X.shape[0]
    n_h = 4
    n_y = Y.shape[0]
    return (n_x,n_h,n_y)

# 3-2 初始化模型参数
def initialize_parameters(n_x,n_h,n_y):
    np.random.seed(2)

    W1 = np.random.randn(n_h,n_x)
    W2 = np.random.randn(n_y,n_h)
    b1 = np.zeros((n_h,1))
    b2 = np.zeros((n_y,1))

    assert(W1.shape == (n_h,n_x))
    assert(W2.shape == (n_y,n_h))
    assert(b1.shape == (n_h,1))
    assert(b2.shape == (n_y,1))

    parameters = {"W1":W1, "W2":W2, "b1":b1, "b2":b2}
    return parameters

# 3-3 计算前向传播
def forward_propagation(X,parameters):
    W1 = parameters["W1"]
    W2 = parameters["W2"]
    b1 = parameters["b1"]
    b2 = parameters["b2"]

    Z1 = np.dot(W1,X) + b1
    A1 = np.tanh(Z1)
    Z2 = np.dot(W2,A1) + b2
    A2 = sigmoid(Z2)

    #assert(A2.shape == (1,X.shape[1]))
    cache = {"Z1":Z1, "Z2":Z2, "A1":A1, "A2":A2}

    return A2,cache

# 3-4 计算损失函数
def compute_cost(A2,Y,parameters):
    m = Y.shape[1]

    #计算交叉熵损失函数
    logprobs = np.multiply(np.log(A2),Y) + np.multiply(np.log(1-A2),1-Y)
    cost = -np.sum(logprobs)/m
    cost = np.squeeze(cost)
    assert(isinstance(cost,float))

    return cost

# 3-5 计算反向传播过程
def backward_propagation(parameters,cache,X,Y):
    m = X.shape[1]
    W1 = parameters["W1"]
    W2 = parameters["W2"]
    A1 = cache["A1"]
    A2 = cache["A2"]

    dZ2 = A2-Y
    dW2 = 1/m * np.dot(dZ2,A1.T)
    db2 = 1/m * np.sum(dZ2, axis=1, keepdims=True)
    dZ1 = np.dot(W2.T,dZ2) * (1-np.power(A1,2))
    dW1 = 1/m * np.dot(dZ1,X.T)
    db1 = 1/m * np.sum(dZ1, axis=1, keepdims=True)

    grads = {"dW1":dW1, "dW2":dW2, "db1":db1, "db2":db2}

    return grads

# 3-6 更新参数
def update_parameters(parameters,grads,learning_rate=1.2):
    W1 = parameters["W1"]
    W2 = parameters["W2"]
    b1 = parameters["b1"]
    b2 = parameters["b2"]

    dW1 = grads["dW1"]
    dW2 = grads["dW2"]
    db1 = grads["db1"]
    db2 = grads["db2"]

    W1 -= learning_rate * dW1
    W2 -= learning_rate * dW2
    b1 -= learning_rate * db1
    b2 -= learning_rate * db2

    parameters = {"W1":W1, "W2":W2, "b1":b1, "b2":b2}

    return parameters

# 3-7 模型
def nn_model(X, Y, n_h, num_iterations=10000, print_cost=False):
    np.random.seed(3)
    n_x = layer_sizes(X, Y)[0]
    n_y = layer_sizes(X, Y)[2]

    parameters = initialize_parameters(n_x, n_h, n_y)
    W1 = parameters["W1"]
    W2 = parameters["W2"]
    b1 = parameters["b1"]
    b2 = parameters["b2"]

    for i in range(0,num_iterations):
        A2, cache = forward_propagation(X, parameters)
        cost = compute_cost(A2, Y, parameters)
        grads = backward_propagation(parameters, cache, X, Y)
        parameters = update_parameters(parameters, grads, learning_rate=0.3)

        if print_cost and i%100==0:
            print("cost after iteration %i: %f" % (i,cost))

    return parameters

# 3-8 预测
def predict(parameters, X):
    A2,cache = forward_propagation(X,parameters)
    predictions = np.around(A2)
    return predictions

# 3-9 运行测试代码
# 下载数据,训练模型
parameters = nn_model(X, Y, n_h=4, num_iterations=10000, print_cost=True)

# 预测正确率
predictions = predict(parameters, X)
print(Y.shape,predictions.shape)
accuracy = float(np.dot(Y,predictions.T)+np.dot(1-Y,1-predictions.T))/Y.size*100
print('Accuracy : %d' % accuracy +'%')

# 画边界
plot_decision_boundary(lambda x: predict(parameters, x.T), X, Y)
plt.title("Decision Boundary for hidden layer size " + str(4))
plt.show()
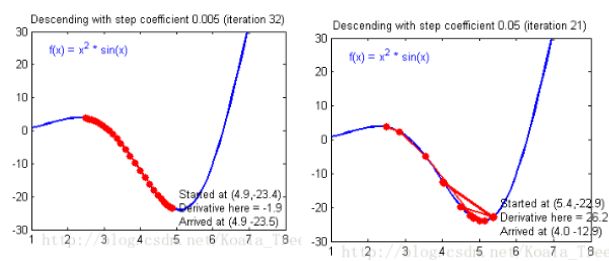
(1)学习率大,收敛速度快,但容易过拟合
(2)神经网络建立模型步骤:
定义网络结构,初始化参数、前向传播、计算损失函数、后向传播、更新参数
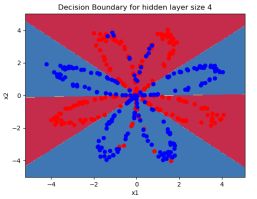
正确率 91%,非线性的分类平面
(3)不同隐含层,分类正确率不同,隐含层太少,拟合函数不复杂


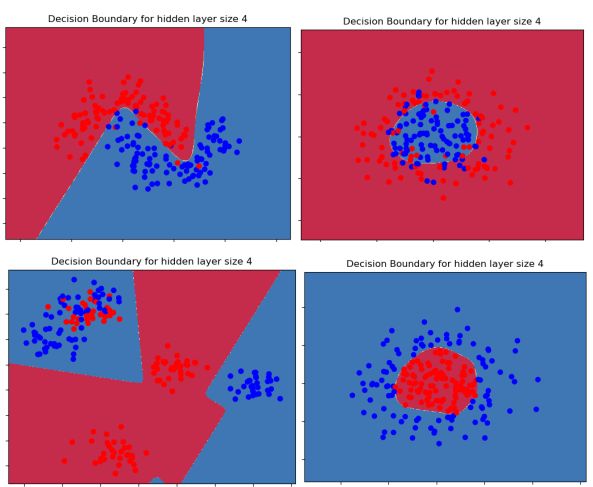
(4)其他数据集正确率 96%,81%,83% ,100%
