sklearn 使用make_classification生成分类样本数据
sklearn 使用make_classification生成分类样本数据
- 1. 介绍
- 2. 函数
- 3. 参数说明
- 4. 代码示例
1. 介绍
sklearn的make_classification函数能生成分类样本数据。
相关推荐:sklearn 使用make_regression生成回归样本数据及NumPy拟合
2. 函数
make_classification(
    n_samples=100,
    n_features=20,
    n_informative=2,
    n_redundant=2,
    n_repeated=0,
    n_classes=2,
    n_clusters_per_class=2,
    weights=None,
    flip_y=0.01,
    class_sep=1.0,
    hypercube=True,
    shift=0.0,
    scale=1.0,
    shuffle=True,
    random_state=None,
)
3. 参数说明
n_samples:样本个数
n_features:样本特征个数,包括信息特征,冗余特征,重复特征,和除去以上特征的无用特征
n_informative:信息特征个数
n_redundant:冗余特征个数
n_repeated:重复特征个数
n_classes:样本类别个数
n_clusters_per_class:每个类的簇的个数
random_state:随机种子指定,以便生成同样的数据集
shuffle:bool, default=True,对样本和特征洗牌
weights:列表类型,每个属性的权重
flip_y:float, default=0.01,随机分配的样本的比例,增大会加大噪声,加大分类难度
shift:float, ndarray of shape (n_features,) or None, default=0.0,对每个属性值进行位移
scale:float, ndarray of shape (n_features,) or None, default=1.0,对每个属性值进行数乘
class_sep:将每个簇分隔开来,较大的值将使分类任务更加容易
4. 代码示例
我们先引入make_classification并调用:
from sklearn.datasets import make_classification
X, Y = make_classification(n_samples=20,n_features=2,n_informative=2,n_clusters_per_class=1,n_classes=2,n_redundant=0,random_state=1)
查看生成的数据长度:
X.shape,Y.shape
((20, 2), (20,))
查看数据:
print(X)
print(Y)
[[ 0.60113836  3.42278643]
 [ 0.92733666  1.34849905]
 [-1.02218089  0.76884573]
 [-0.91616735  1.38382925]
 [ 0.68622624  3.40806982]
 [ 1.02776782  1.22032876]
 [-1.08927846  0.42063027]
 [ 1.03459631  0.49182478]
 [-0.82211871  2.2035513 ]
 [-1.15937004  0.14788636]
 [-1.09153429  0.68714712]
 [-1.1667764   0.02334159]
 [-0.9926918   0.84242108]
 [ 1.27109482 -0.45827898]
 [ 1.01362474  1.76041829]
 [ 0.72643387  2.43081444]
 [-0.88616539  1.74216416]
 [ 0.64586878  2.36354043]
 [ 0.96657191  1.72311415]
 [-1.16565058  0.12766611]]
[0 0 1 1 0 0 1 0 1 1 1 1 1 0 0 0 1 0 0 1]
可视化
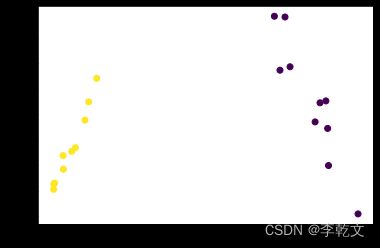
为了看起来比较直观,设置了n_features=2,两个特征分别用x和y轴展示。
import matplotlib.pyplot as plt
XT=X.T
plt.scatter(
    XT[0], #x坐标
    XT[1], #y坐标
    c=Y
)
plt.show()
