matplotlib绘图---折线图
本文仅记录了一些自己会使用到的知识,若没有帮到您,我感到很抱歉!
matplotlib官网各种绘图示例
文章目录
- 一、绘图基础
-
- 1. 最基础代码
- 2. 绘制不同类型图
- 3. 中文不显示问题
- 二、相关参数设置
-
- 1. 坐标轴刻度
-
- 1.1 标签
- 1.2 轴标签自定义字符串
- 1.3 刻度间隔显示
- 2. 图像
-
- 2.1 图形大小及清晰度
- 2.2 图例
- 2.3 网格
- 2.4 标记特殊点
一、绘图基础
1. 最基础代码
import matplotlib.pyplot as plt
x = range(2, 26, 2)
y = [15, 13, 14.5, 17, 20, 25, 26, 26, 24, 22, 18, 15]
plt.plot(x, y)
plt.show()
2. 绘制不同类型图
plt.plot(x, y, color='r', linestyle='--', linewidth=5, alpha=0.5, label="y1") # 绘制折线图
plt.scatter(x, y) # 绘制散点图
plt.bar(x, y, width=0.3) # 绘制条形图
plt.barh(x, y, height=0.4) # 绘制横向条形图
注:x和y必须是数值型数据
3. 中文不显示问题
plt.rcParams['font.sans-serif']=['SimHei'] #显示中文标签
plt.rcParams['axes.unicode_minus']=False
二、相关参数设置
1. 坐标轴刻度
1.1 标签
plt.title("一段时间内的气温变化情况") # 图的标题
plt.xlabel("时间")  # x轴标签
plt.ylabel("温度") # y轴标签
1.2 轴标签自定义字符串
x = range(1, 8)
x_label = ["代号:{}".format(i) for i in x]
plt.xticks(x, x_label)
1.3 刻度间隔显示
x = range(1, 8)
plt.xticks(x[::3]) # 刻度从1开始间隔3个数显示(1,4,7)
2. 图像
2.1 图形大小及清晰度
plt.figure(figsize=(20,8), dpi=80)
注:dpi指清晰度,越高越清晰
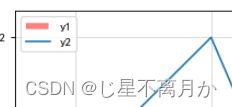
2.2 图例
# 绘图
plt.plot(x, y1, label="y1")
plt.plot(x, y2, label="y2")
plt.legend(loc="lower left") # 添加图例
注:loc默认居于合适位置,其他参数如下:
上左:upper left;上右:upper right;下左:lower left;下右:lower right;中左:center left;中右:center right;上中:upper center;下中:lower center;右:right;中:center

2.3 网格
plt.grid(alpha=0.5) # 绘制网格
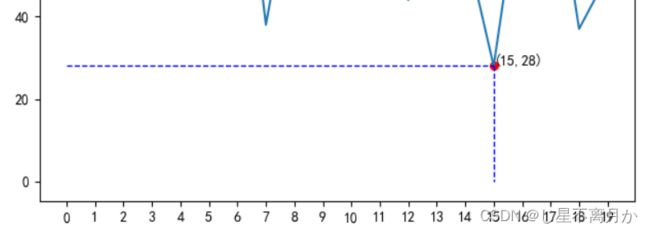
2.4 标记特殊点
def draw_spot(x0, y0):
    plt.scatter(x0, y0, s=30, color='r')  # 用蓝色描出一点,尺寸为50
    # plot参数中左侧[]指x的范围,右侧[]指y的范围
    plt.plot([x0, x0], [y0, 0], 'b--', lw=1)  # 用虚线连接(x0, y0)和(x0, 0)两点
    plt.plot([0, x0], [y0, y0], 'b--', lw=1)  # 用虚线连接(x0, y0)和(0, y0)两点
    show_spot = '(' + str(x0) + ',' + str(y0) + ')'
    plt.annotate(show_spot, xy=(x0, y0), xytext=(x0, y0))


