使用Python实现支持向量机 -------文章中有源码
一、实验目的
使用Python实现支持向量机。
二、Python包
(1)sklearn
(2)mglearn
(3)matplotlib
(4)numpy
三、实验步骤
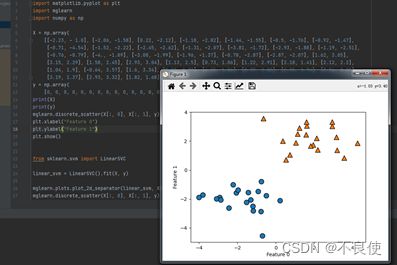
(1)数据集引入,并使用图像展示
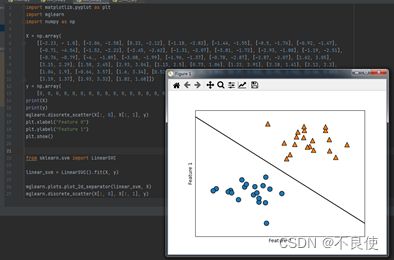
(2)使用SVM进行分类
(注:用于分类的线性模型只能用一条直线来划分数据点,对这个数据集无法给出较好的结果)
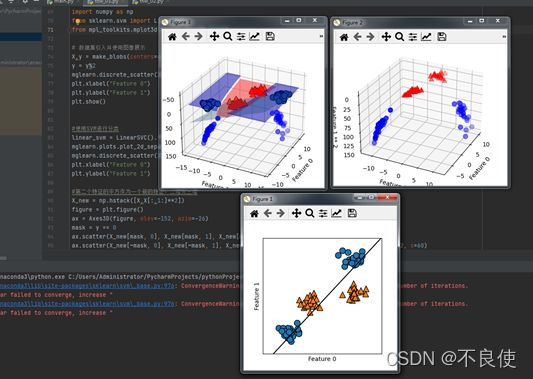
(3)现在我们对输入特征进行扩展,比如说添加第二个特征的平方(feature1 ** 2)作为一个新特征。现在我们将每个数据点表示为三维点(feature0, feature1,feature1 ** 2),而不是二维点(feature0, feature1)
(4)在数据的新表示中,现在可以用线性模型(三维空间中的平面)将这两个类别分开。我们可以用线 性模型拟合扩展后的数据来验证这一点。
(5)如果将线性SVM模型看作原始特征的函数,那么它实际上已经不是线性的了。它不是一条直线,而是一个椭圆。
代码:
from sklearn.datasets import make_blobs
import mglearn
import matplotlib.pyplot as plt
import numpy as np
from sklearn.svm import LinearSVC
from mpl_toolkits.mplot3d import Axes3D,axes3d

# 数据集引入并使用图像展示
X,y = make_blobs(centers=4,random_state=8)
y = y%2
mglearn.discrete_scatter(X[:,0],X[:,1],y)
plt.xlabel("Feature 0")
plt.ylabel("Feature 1")
plt.show()


#使用SVM进行分类
linear_svm = LinearSVC().fit(X,y)
mglearn.plots.plot_2d_separator(linear_svm,X)
mglearn.discrete_scatter(X[:,0],X[:,1],y)
plt.xlabel("Feature 0")
plt.ylabel("Feature 1")

#第二个特征的平方作为一个新的特征,二维变三维
X_new = np.hstack([X,X[:,1:]**2])
figure = plt.figure()
ax = Axes3D(figure, elev=-152, azim=-26)
mask = y == 0
ax.scatter(X_new[mask, 0], X_new[mask, 1], X_new[mask, 2], c='b', cmap=mglearn.cm2, s=60)
ax.scatter(X_new[~mask, 0], X_new[~mask, 1], X_new[~mask, 2], c='r', marker='^', cmap=mglearn.cm2, s=60)
ax.set_xlabel("Feature 0")
ax.set_ylabel("Feature 1")
ax.set_zlabel("Feature 1 ** 2")


#三维
linear_svm_3d = LinearSVC().fit(X_new,y)
coef,intercept = linear_svm_3d.coef_.ravel(),linear_svm_3d.intercept_
figure = plt.figure()
ax = Axes3D(figure,elev=-152,azim=-26)
xx = np.linspace(X_new[:, 0].min() - 2, X_new[:, 0].max() + 2, 50)
yy = np.linspace(X_new[:, 1].min() - 2, X_new[:, 1].max() + 2, 50)
XX,YY = np.meshgrid(xx,yy)
ZZ = (coef[0]*XX+coef[1]*YY+intercept)/-coef[2]
ax.plot_surface(XX,YY,ZZ,rstride=8,cstride=8,alpha=0.3)
ax.scatter(X_new[mask,0],X_new[mask,1],X_new[mask,2],c='b',cmap=mglearn.cm2,s=60)
ax.scatter(X_new[~mask,0],X_new[~mask,1],X_new[~mask,2],c='r', marker='^', cmap=mglearn.cm2,s=60)
ax.set_xlabel("Feature 0")
ax.set_ylabel("Feature 1")
ax.set_zlabel("Feature 1 ** 2")


#降维
ZZ = YY ** 2
dec = linear_svm_3d.decision_function(np.c_[XX.ravel(),YY.ravel(),ZZ.ravel()])
plt.contourf(XX,YY,dec.reshape(XX.shape),levels=[dec.min(),0,dec.max()],
    cmap=mglearn.cm2,alpha=0.5)
mglearn.discrete_scatter(X[:,0],X[:,1],y)
plt.xlabel("Feature 0")
plt.ylabel("Feature 1")
plt.show()
实验六 支持向量机(补充)
一、实验目的
使用Python实现支持向量机。
二、实验原理
支持向量机所作的事情其实非常容易理解。先来看看下面这一组数据的分布,这是一组两种标签的数据,两种标签分别由圆和方块代表。支持向量机的分类方法,是在这组分布中找出一个超平面作为决策边界,使模型在数据上的分类误差尽量接近于小,尤其是在未知数据集上的分类误差(泛化误差)尽量小。
三、Python包
(1)sklearn
(2)mglearn
(3)matplotlib
(4)numpy
四、问题描述
有如下数据集:
X :
[[-2.23 -1. ]
[-2.06 -1.58]
[ 0.22 -2.12]
[-1.18 -2.82]
[-1.44 -1.55]
[-0.5 -1.76]
[-0.92 -1.47]
[-0.71 -4.54]
[-1.52 -2.22]
[-2.45 -2.62]
[-1.31 -2.07]
[-3.81 -1.72]
[-2.93 -1.88]
[-1.19 -2.51]
[-0.76 -0.79]
[-4. -1.89]
[-3.08 -1.99]
[-1.96 -1.37]
[-0.78 -2.87]
[-2.87 -2.07]
[ 1.62 3.05]
[ 3.15 2.29]
[ 1.58 2.45]
[ 2.93 3.04]
[ 1.13 2.5 ]
[ 0.73 1.06]
[ 1.22 2.91]
[ 2.18 1.41]
[ 2.12 2.2 ]
[ 1.04 1.9 ]
[-0.64 3.57]
[ 1.6 3.34]
[ 0.52 0.73]
[ 4.25 1.86]
[ 0.37 2.02]
[ 1.95 1.74]
[ 3.56 0.85]
[ 3.19 1.37]
[ 2.93 3.32]
[ 1.82 1.68]]
Y:
[0, 0, 0, 0, 0, 0, 0, 0, 0, 0, 0, 0, 0, 0, 0, 0, 0, 0, 0, 0, 1, 1, 1, 1, 1, 1, 1, 1, 1, 1, 1, 1, 1, 1, 1, 1, 1, 1, 1, 1]
试采用sklearn 包使用SVM算法对其进行分类。
代码:
import matplotlib.pyplot as plt
import mglearn
import numpy as np

X = np.array(
    [[-2.23, - 1.0], [-2.06, -1.58], [0.22, -2.12], [-1.18, -2.82], [-1.44, -1.55], [-0.5, -1.76], [-0.92, -1.47],
     [-0.71, -4.54], [-1.52, -2.22], [-2.45, -2.62], [-1.31, -2.07], [-3.81, -1.72], [-2.93, -1.88], [-1.19, -2.51],
     [-0.76, -0.79], [-4., -1.89], [-3.08, -1.99], [-1.96, -1.37], [-0.78, -2.87], [-2.87, -2.07], [1.62, 3.05],
     [3.15, 2.29], [1.58, 2.45], [2.93, 3.04], [1.13, 2.5], [0.73, 1.06], [1.22, 2.91], [2.18, 1.41], [2.12, 2.2],
     [1.04, 1.9], [-0.64, 3.57], [1.6, 3.34], [0.52, 0.73], [4.25, 1.86], [0.37, 2.02], [1.95, 1.74], [3.56, 0.85],
     [3.19, 1.37], [2.93, 3.32], [1.82, 1.68]])
y = np.array(
    [0, 0, 0, 0, 0, 0, 0, 0, 0, 0, 0, 0, 0, 0, 0, 0, 0, 0, 0, 0, 1, 1, 1, 1, 1, 1, 1, 1, 1, 1, 1, 1, 1, 1, 1, 1, 1, 1,1, 1])
print(X)
print(y)
mglearn.discrete_scatter(X[:, 0], X[:, 1], y)
plt.xlabel("Feature 0")
plt.ylabel("Feature 1")
plt.show()


from sklearn.svm import LinearSVC

linear_svm = LinearSVC().fit(X, y)

mglearn.plots.plot_2d_separator(linear_svm, X)
mglearn.discrete_scatter(X[:, 0], X[:, 1], y)
plt.xlabel("Feature 0")
plt.ylabel("Feature 1")
plt.show()
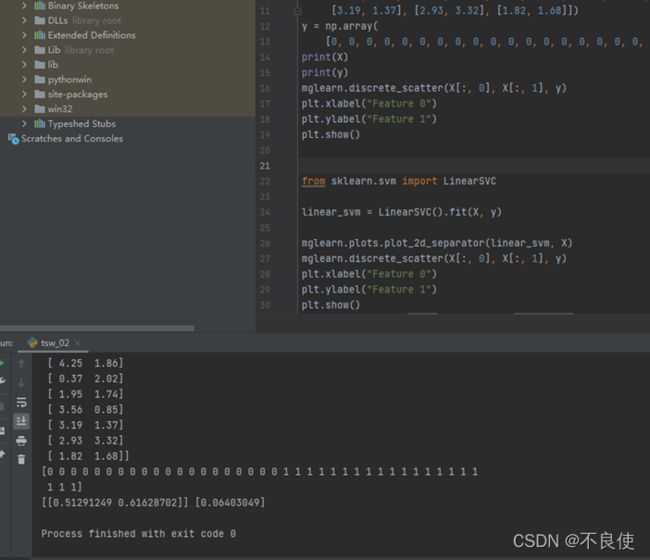
w, b = linear_svm.coef_, linear_svm.intercept_
print(w, b)


