pyechart绘制多条y轴折线图
pyechart绘制多条y轴折线图
绘制三条折线,并使用不同的y轴:使用如下数据绘制折线图,并根据单位分别设置y轴
数据:
x_data=['06-24 21:00','06-24 20:00','06-24 19:00','06-24 18:00',            #x轴
    '06-24 17:00','06-24 16:00','06-24 15:00','06-24 14:00','06-24 13:00',
    '06-24 12:00','06-24 11:00','06-24 10:00','06-24 09:00','06-24 08:00',
    '06-24 07:00','06-24 06:00','06-24 05:00','06-24 04:00','06-24 03:00',
    '06-24 02:00','06-24 01:00','06-24 00:00','06-23 23:00','06-23 22:00']
pm25=[20.0,24.0,26.0,24.0,21.0,19.0,19.0,18.0,17.0,16.0,19.0,21.0,23.0,     #y0轴   单位ug/m³
    26.0,28.0,26.0,26.0,26.0,26.0,25.0,25.0,26.0,25.0,24.0,]
aqi=[52.0,94.0,116.0,138.0,139.0,133.0,128.0,120.0,112.0,110.0,105.0,       #y1轴   无单位
    70.0,58.0,57.0,52.0,51.0,49.0,48.0,51.0,53.0,51.0,53.0,54.0,73.0,]
co=[0.434,0.444,0.52,0.519,0.495,0.49,0.508,0.503,0.498,0.499,0.55,0.642,  #y2轴   单位mg/m³
    0.727,0.8,0.819,0.767,0.752,0.729,0.72,0.743,0.755,0.753,0.767,0.748,]
在添加y轴数据时使用yaxis_index指定y轴的索引,`
line.add_yaxis(         #第一条曲线
    series_name='PM2.5',
    y_axis=pm25,
    label_opts=opts.LabelOpts(is_show=False),
    yaxis_index=0,      #设置y索引轴
    is_smooth=True,
)
line.add_yaxis(         #添加第二条曲线
    series_name='AQI',
    y_axis=aqi,
    label_opts=opts.LabelOpts(is_show=False),
    yaxis_index=1,      #设置y索引轴
    is_smooth=True,
)
line.add_yaxis(         #添加第三条曲线
    series_name='CO',
    y_axis=co,
    label_opts=opts.LabelOpts(is_show=False),
    yaxis_index=2,      #设置y轴
    is_smooth=True,
)
使用extend_axis方法添加y轴并指定格式,position参数设置添加的y轴位置,position='left'为左边,position='right'为右边;offset参数设置各y轴之间的距离。添加的y轴索引从yaxis_index=1开始。yaxis_index=0为主y轴,在set_global_opts中设置其具体格式。
line.extend_axis(
    yaxis=opts.AxisOpts(type_='value', position='right'))
line.extend_axis(
    yaxis=opts.AxisOpts(
        name='mg/m³',
        type_='value',
        position='left', offset=40))
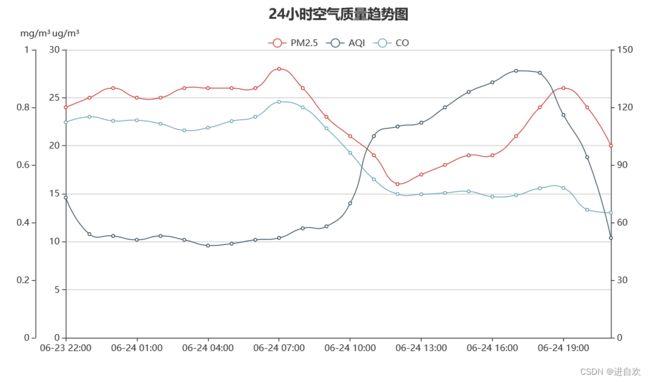
效果图:
全部代码:
import pyecharts.options as opts
from pyecharts.charts import Line

x_data=['06-24 21:00','06-24 20:00','06-24 19:00','06-24 18:00',            #x轴
    '06-24 17:00','06-24 16:00','06-24 15:00','06-24 14:00','06-24 13:00',
    '06-24 12:00','06-24 11:00','06-24 10:00','06-24 09:00','06-24 08:00',
    '06-24 07:00','06-24 06:00','06-24 05:00','06-24 04:00','06-24 03:00',
    '06-24 02:00','06-24 01:00','06-24 00:00','06-23 23:00','06-23 22:00']
pm25=[20.0,24.0,26.0,24.0,21.0,19.0,19.0,18.0,17.0,16.0,19.0,21.0,23.0,     #y0轴   单位ug/m³
    26.0,28.0,26.0,26.0,26.0,26.0,25.0,25.0,26.0,25.0,24.0,]
aqi=[52.0,94.0,116.0,138.0,139.0,133.0,128.0,120.0,112.0,110.0,105.0,       #y1轴   无单位
    70.0,58.0,57.0,52.0,51.0,49.0,48.0,51.0,53.0,51.0,53.0,54.0,73.0,]
co=[0.434,0.444,0.52,0.519,0.495,0.49,0.508,0.503,0.498,0.499,0.55,0.642,  #y2轴   单位mg/m³
    0.727,0.8,0.819,0.767,0.752,0.729,0.72,0.743,0.755,0.753,0.767,0.748,]

x_data=x_data[::-1]     #按照时间顺序排列
pm25=pm25[::-1]
aqi=aqi[::-1]
co=co[::-1]
line=Line().add_xaxis(xaxis_data=x_data)    #添加x轴
line.add_yaxis(         #第一条曲线
    series_name='PM2.5',
    y_axis=pm25,
    label_opts=opts.LabelOpts(is_show=False),
    yaxis_index=0,      #设置y轴
    is_smooth=True,
)
line.add_yaxis(         #添加第二条曲线
    series_name='AQI',
    y_axis=aqi,
    label_opts=opts.LabelOpts(is_show=False),
    yaxis_index=1,      #设置y轴
    is_smooth=True,
)
line.add_yaxis(         #添加第三条曲线
    series_name='CO',
    y_axis=co,
    label_opts=opts.LabelOpts(is_show=False),
    yaxis_index=2,      #设置y轴
    is_smooth=True,
)

line.extend_axis(
    yaxis=opts.AxisOpts(type_='value', position='right'))
line.extend_axis(
    yaxis=opts.AxisOpts(
        name='mg/m³',
        type_='value',
        position='left', offset=40))
line.set_global_opts(
    title_opts=opts.TitleOpts(title='24小时空气质量趋势图',pos_top='top', pos_left='center'),
    tooltip_opts=opts.TooltipOpts(trigger="axis"),
    yaxis_opts=opts.AxisOpts(
        name='ug/m³',
        type_="value",
        axistick_opts=opts.AxisTickOpts(is_show=True),
        splitline_opts=opts.SplitLineOpts(is_show=True),
    ),
    legend_opts=opts.LegendOpts(pos_top='40'),
    xaxis_opts=opts.AxisOpts(type_="category", boundary_gap=False),)
line.render('li.html')