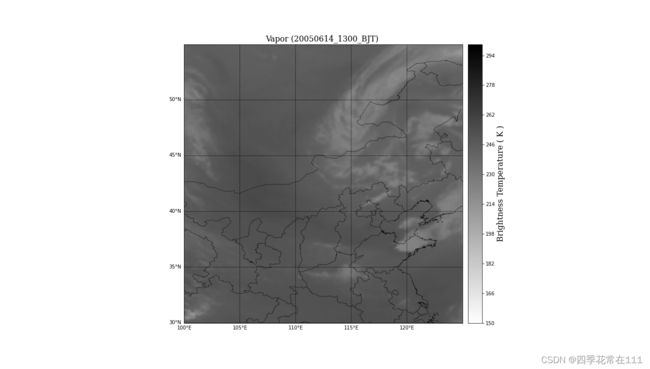
python读取FY-2C卫星的hdf数据绘图-水汽
如图,读取FY-2c的hdf文件(为总文件不是TBB)画水汽云图。主要参照了前辈的代码如链接:https://blog.csdn.net/weixin_44052055/article/details/118890053?spm=1001.2014.3001.5506 。
基本思路依旧是:
代码如下:
import h5py
import cmaps
import numpy as np
import matplotlib.pyplot as plt
from mpl_toolkits.basemap import Basemap

#%matplotlib inline

# 从hdf文件中获取亮温值
def getTBBFromhdf():
    hdfFile = h5py.File('FY2C_FDI_ALL_NOM_20050614_0456.hdf', 'r')
    db1 = hdfFile['/CALChannelIR3']
    hw1 = hdfFile['/NOMChannelIR3']
    # db2 = hdfFile['/CALChannelIR2']
    # hw2 = hdfFile['/NOMChannelIR2']
    # db3 = hdfFile['/CALChannelIR3']
    # hw3 = hdfFile['/NOMChannelIR3']
    # db4 = hdfFile['/CALChannelIR4']
    # hw4 = hdfFile['/NOMChannelIR4']
    infoh = hdfFile['/NomFileInfo']
 # 查看卫星的经纬度
#    print(infoh)
    lat_hdf = infoh[0][4] #这里原作者用的是3和4,他是G星,但是C似乎对应不上,用4和5就可以,欢迎讨论
    lon_hdf = infoh[0][5]
    # print(lat_hdf)
    # print(lon_hdf)
    hw = hw1[()]
    db = db1[()]  # 获取定标表的值
    tb = np.zeros(shape=(2288, 2288))  # 2288*2288的图像每个具体的亮温值
    for i in range(2288):
        for j in range(2288):
            if hw[i][j] == 65535 or hw[i][j] == 65534:
                tb[i][j] = 0
            else:
                a = hw[i][j]
                tb[i][j] = db[0][a]
    tb = tb.T
    return tb
#调用函数
tb=getTBBFromhdf()

#%%
lonlatfile = 'g:/NOM_ITG_2288_2288(0E0N)_LE.dat'
with open(lonlatfile, 'rb') as f:
        #lon_fy = np.fromfile(f, count=2288 * 2288, dtype='float32') + 79  # 先存经度,根据卫星的不同加上对应的经度值
        #lat_fy = np.fromfile(f, count=2288 * 2288, dtype='float32')  # 再存纬度
        data = np.fromfile(f, dtype='float32')
        data = data.reshape([2288, 2288, 2], order='F')
    #lon = lon_fy.reshape([2288, 2288], order='F')
    #lat = lat_fy.reshape([2288, 2288], order='F')
lon = data[:, :, 0] + 104.5
lat = data[:, :, 1]

#plt.imshow(data[:, :, 1])
#%%


fig = plt.figure(figsize=(18.5, 10.5))
m = Basemap(projection='cyl', llcrnrlat=30, llcrnrlon=100, urcrnrlat=55,  urcrnrlon=125)  # 使用Basemap绘制地图,这里可以读取对应的地图shp文件。
m = Basemap(llcrnrlon=100, llcrnrlat=30, urcrnrlon=125, urcrnrlat=55)
m.readshapefile(r'G:/China2020/bou2_4l','states',drawbounds = True) #这个是省 bount-line是县界
x, y = m(lon, lat)  # 将lats / lons转换为地图投影坐标
# 绘制轮廓图

cf = m.contourf(x, y, tb, levels=np.linspace(150, 300, 151), cmap='gist_gray_r')
cbar = m.colorbar(cf, location='right', size='5%', pad='2%')

font = {'family': 'serif',
        'color': 'black',
        'weight': 'normal',
        'size': 16,
        }
cbar.set_label('Brightness Temperature ( K )', fontdict=font)
m.drawmeridians(np.arange(100, 125, 5), labels=[0, 0, 0, 1])
m.drawparallels(np.arange(30, 55, 5), labels=[1, 0, 0, 0])
# 将最佳路径集上的经纬度映射到地图上,再把该点绘制在地图上
#best_lon, best_lat = m(best_lon, best_lat)
#m.plot(best_lon, best_lat, 'o', color='fuchsia', ms=5)
plt.xticks(fontsize=20)
plt.yticks(fontsize=20)
plt.title('Vapor (20050614_1300_BJT) ', fontdict=font)
plt.savefig('F:/20050614_1300.png')
plt.show()
