微分方程(人口预测与传染病模型)
一、定义
-
微分方程:含导数或微分的方程
-
微分方程的阶数:所含导数或微分的最高阶数,如y’’’+2y’’-2x=0是三阶微分方程
-
微分方程的解:使得微分方程成立的函数 例如y’-2x=0的解可以为x²或者x²+1
-
微分方程的通解和特解:特解为满足等式条件即可
-
初值条件:如y(0)=1
二、微分方程模型
1、人口预测模型
2、微分方程解析解
ODE 常微分方程
(求解析解的问题,Matlab代码简介,运算效率高)
% dy/dx = 2x , y(1) = 2
dsolve('Dy=2*x','y(1)=2','x')

% d2s/dt2 = -0.4 , s(0) = 0 , Ds(0) = 20
dsolve('D2s=-0.4','s(0)=0,Ds(0)=20','t')

% dy/dx = 2xy
dsolve('Dy=2*x*y','x')

% dM/dt = -nM , M(0) = M0
dsolve('DM=-n*M','M(0)=M0','t')

% dt/dh*KS(2gh)**(1/2)  = -pi(2h-h**2) , t(1) = 0
dsolve('Dt*K*S*(2*g*h)^(1/2)=-pi*(2*h-h^2)','t(1)=0','h')

% y**2+x**2*dy/dx = xy*dy/dx
dsolve('y^2+x^2*Dy=x*y*Dy','x')

% y''' = e**2x - cos(x)
dsolve('D3y=exp(2*x)-cos(x)','x')
三、传染病模型
今年疫情,传染病模型又将成为一波建模热潮,以下涉及传染病模型包括SI、SIS、SIR、SIRS、SEIR、SEIRS共六个模型:
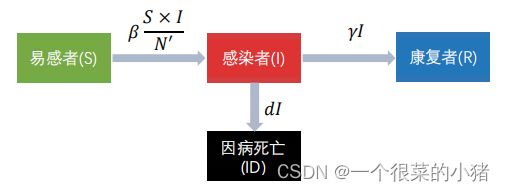
- 易感者S(Susceptible person):可感染人群
- 感染者I(Infected individual):确诊人群
- 潜伏者E(Exposed person):已经被传染但没有表现出来的人群
- 康复者R(Recovered person):已痊愈的感染者
模型一:SI-Model
①原始模型
import scipy.integrate as spi
import numpy as np
import matplotlib.pyplot as plt

# N为人群总数
N = 10000
# β为传染率系数
beta = 0.25
# gamma为恢复率系数
gamma = 0
# I_0为感染者的初始人数
I_0 = 1
# S_0为易感者的初始人数
S_0 = N - I_0
# T为传播时间
T = 150

# INI为初始状态下的数组
INI = (S_0,I_0)


def funcSI(inivalue,_):
    Y = np.zeros(2)
    X = inivalue
    # 易感个体变化
    Y[0] = - (beta * X[0] * X[1]) / N + gamma * X[1]
    # 感染个体变化
    Y[1] = (beta * X[0] * X[1]) / N - gamma * X[1]
    return Y

T_range = np.arange(0,T + 1)

RES = spi.odeint(funcSI,INI,T_range)


plt.plot(RES[:,0],color = 'darkblue',label = 'Susceptible',marker = '.')
plt.plot(RES[:,1],color = 'red',label = 'Infection',marker = '.')
plt.title('SI Model')
plt.legend()
plt.xlabel('Day')
plt.ylabel('Number')
plt.show()
感染者数量逐渐上升,易感染者数量逐渐下降,直至为0
②考虑某种因素使得参数β降低
如禁止大规模聚会、采取隔离措施
β降低
③考虑人口出生率和死亡率的因素
④考虑疾病死亡率的因素(不考虑人口出生率和死亡率)
⑤同时考虑疾病死亡率的因素和人口出生率和死亡率
模型二:SIS-Model
①原始模型
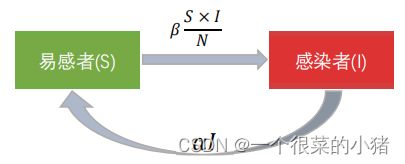
假设从某种疾病恢复后仍然不能产生抗体,未来仍然可能患病,那我们会经历:感染-恢复-再感染,不断循环。


import scipy.integrate as spi
import numpy as np
import matplotlib.pyplot as plt

# N为人群总数
N = 10000
# β为传染率系数
beta = 0.25
# gamma为恢复率系数
gamma = 0.05
# I_0为感染者的初始人数
I_0 = 1
# S_0为易感者的初始人数
S_0 = N - I_0
# T为传播时间
T = 150

# INI为初始状态下的数组
INI = (S_0,I_0)


def funcSIS(inivalue,_):
    Y = np.zeros(2)
    X = inivalue
    # 易感个体变化
    Y[0] = - (beta * X[0]) / N * X[1] + gamma * X[1]
    # 感染个体变化
    Y[1] = (beta * X[0] * X[1]) / N - gamma * X[1]
    return Y

T_range = np.arange(0,T + 1)

RES = spi.odeint(funcSIS,INI,T_range)

plt.plot(RES[:,0],color = 'darkblue',label = 'Susceptible',marker = '.')
plt.plot(RES[:,1],color = 'red',label = 'Infection',marker = '.')
plt.title('SIS Model')
plt.legend()
plt.xlabel('Day')
plt.ylabel('Number')
plt.show()
当恢复系数gamma = 0.05时:

当恢复系数gamma = 0.1时:

②考虑某种因素使得α参数增加
如建立医院、升级医疗装备、开发疫苗
α增加
模型三:SIR-Model
①原始模型
某些疾病发病迅速,但康复后会产生抗体,不会再次被感染,如天花、麻疹等。

康复率为γ
import scipy.integrate as spi
import numpy as np
import matplotlib.pyplot as plt

# N为人群总数
N = 10000
# β为传染率系数
beta = 0.25
# gamma为恢复率系数
gamma = 0.05
# I_0为感染者的初始人数
I_0 = 1
# R_0为治愈者的初始人数
R_0 = 0
# S_0为易感者的初始人数
S_0 = N - I_0 - R_0
# T为传播时间
T = 150

# INI为初始状态下的数组
INI = (S_0,I_0,R_0)


def funcSIR(inivalue,_):
    Y = np.zeros(3)
    X = inivalue
    # 易感个体变化
    Y[0] = - (beta * X[0] * X[1]) / N
    # 感染个体变化
    Y[1] = (beta * X[0] * X[1]) / N - gamma * X[1]
    # 治愈个体变化
    Y[2] = gamma * X[1]
    return Y

T_range = np.arange(0,T + 1)

RES = spi.odeint(funcSIR,INI,T_range)


plt.plot(RES[:,0],color = 'darkblue',label = 'Susceptible',marker = '.')
plt.plot(RES[:,1],color = 'red',label = 'Infection',marker = '.')
plt.plot(RES[:,2],color = 'green',label = 'Recovery',marker = '.')
plt.title('SIR Model')
plt.legend()
plt.xlabel('Day')
plt.ylabel('Number')
plt.show()
②考虑某种因素使得参数γ增加
如研发疫苗、升级医疗装备
γ增加
③考虑疾病死亡率的因素(不考虑人口出生率和死亡率的因素)
模型四:SIRS-Model
①原始模型
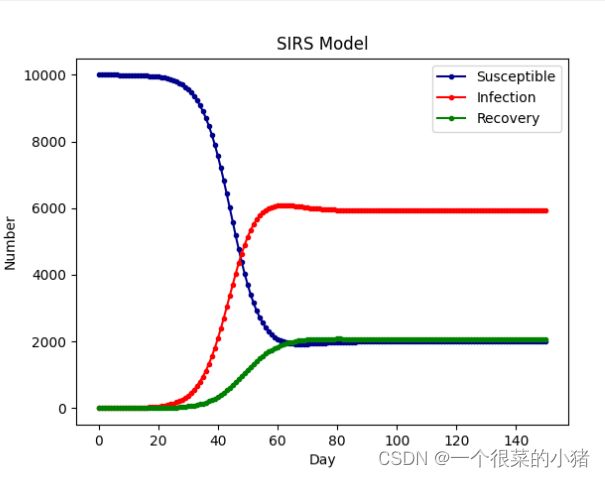
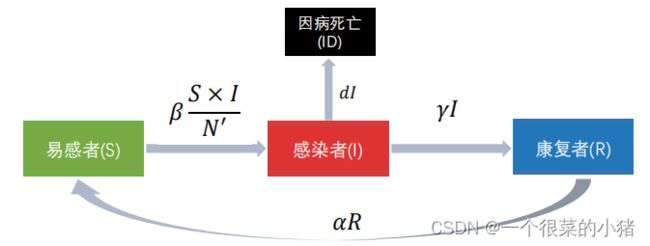
模型中康复者R可能会以a的转移率再次变为易感者S,可以看作是SIS和SIR的融合:


代码1:抗体持续时间为7天,七天后可被再次感染:
import scipy.integrate as spi
import numpy as np
import matplotlib.pyplot as plt

# N为人群总数
N = 10000
# β为传染率系数
beta = 0.25
# gamma为恢复率系数
gamma = 0.05
# Ts为抗体持续时间
Ts = 7
# I_0为感染者的初始人数
I_0 = 1
# R_0为治愈者的初始人数
R_0 = 0
# S_0为易感者的初始人数
S_0 = N - I_0 - R_0
# T为传播时间
T = 150

# INI为初始状态下的数组
INI = (S_0,I_0,R_0)


def funcSIRS(inivalue,_):
    Y = np.zeros(3)
    X = inivalue
    # 易感个体变化
    Y[0] = - (beta * X[0] * X[1]) / N + X[2] / Ts
    # 感染个体变化
    Y[1] = (beta * X[0] * X[1]) / N - gamma * X[1]
    # 治愈个体变化
    Y[2] = gamma * X[1] - X[2] / Ts
    return Y

T_range = np.arange(0,T + 1)

RES = spi.odeint(funcSIRS,INI,T_range)


plt.plot(RES[:,0],color = 'darkblue',label = 'Susceptible',marker = '.')
plt.plot(RES[:,1],color = 'red',label = 'Infection',marker = '.')
plt.plot(RES[:,2],color = 'green',label = 'Recovery',marker = '.')
plt.title('SIRS Model')
plt.legend()
plt.xlabel('Day')
plt.ylabel('Number')
plt.show()
代码2:a再次感染转移率为0.05
import scipy.integrate as spi
import numpy as np
import matplotlib.pyplot as plt

# N为人群总数
N = 10000
# β为传染率系数
beta = 0.25
# gamma为恢复率系数
gamma = 0.05
# I_0为感染者的初始人数
I_0 = 1
# R_0为治愈者的初始人数
R_0 = 0
# S_0为易感者的初始人数
S_0 = N - I_0 - R_0
# T为传播时间
T = 150
# a为再次感染的转移率
arfa = 0.05

# INI为初始状态下的数组
INI = (S_0,I_0,R_0)


def funcSIRS(inivalue,_):
    Y = np.zeros(3)
    X = inivalue
    # 易感个体变化
    Y[0] = - (beta * X[0] * X[1]) / N + arfa * X[2]
    # 感染个体变化
    Y[1] = (beta * X[0] * X[1]) / N - gamma * X[1]
    # 治愈个体变化
    Y[2] = gamma * X[1] - arfa * X[2]
    return Y

T_range = np.arange(0,T + 1)

RES = spi.odeint(funcSIRS,INI,T_range)


plt.plot(RES[:,0],color = 'darkblue',label = 'Susceptible',marker = '.')
plt.plot(RES[:,1],color = 'red',label = 'Infection',marker = '.')
plt.plot(RES[:,2],color = 'green',label = 'Recovery',marker = '.')
plt.title('SIRS Model')
plt.legend()
plt.xlabel('Day')
plt.ylabel('Number')
plt.show()
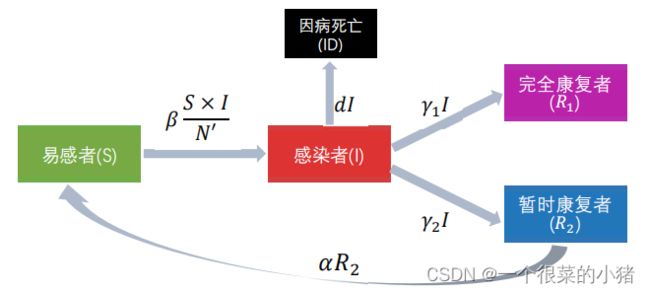
②考虑疾病死亡率的因素
②考虑抗体的因素
康复后,有部分人群获得抗体,成为完全康复者;有部分人群暂时不会获得抗体,未来还可能被感染,成为暂时康复者。

模型五:SEIR-Model
①原始模型
某些疾病具有潜伏期,被传染的人群会进入潜伏期E,潜伏着转化为感染者有一个速率σ,并且潜伏着不具有传染性。


代码1:潜伏期为14天
import scipy.integrate as spi
import numpy as np
import matplotlib.pyplot as plt

# N为人群总数
N = 10000
# β为传染率系数
beta = 0.6
# gamma为恢复率系数
gamma = 0.1
# Te为疾病潜伏期
Te = 14
# I_0为感染者的初始人数
I_0 = 1
# E_0为潜伏者的初始人数
E_0 = 0
# R_0为治愈者的初始人数
R_0 = 0
# S_0为易感者的初始人数
S_0 = N - I_0 - E_0 - R_0
# T为传播时间
T = 150

# INI为初始状态下的数组
INI = (S_0,E_0,I_0,R_0)


def funcSEIR(inivalue,_):
    Y = np.zeros(4)
    X = inivalue
    # 易感个体变化
    Y[0] = - (beta * X[0] * X[2]) / N
    # 潜伏个体变化
    Y[1] = (beta * X[0] * X[2]) / N - X[1] / Te
    # 感染个体变化
    Y[2] = X[1] / Te - gamma * X[2]
    # 治愈个体变化
    Y[3] = gamma * X[2]
    return Y

T_range = np.arange(0,T + 1)

RES = spi.odeint(funcSEIR,INI,T_range)


plt.plot(RES[:,0],color = 'darkblue',label = 'Susceptible',marker = '.')
plt.plot(RES[:,1],color = 'orange',label = 'Exposed',marker = '.')
plt.plot(RES[:,2],color = 'red',label = 'Infection',marker = '.')
plt.plot(RES[:,3],color = 'green',label = 'Recovery',marker = '.')

plt.title('SEIR Model')
plt.legend()
plt.xlabel('Day')
plt.ylabel('Number')
plt.show()
import scipy.integrate as spi
import numpy as np
import matplotlib.pyplot as plt

# N为人群总数
N = 10000
# β为传染率系数
beta = 0.6
# gamma为恢复率系数
gamma = 0.1
# I_0为感染者的初始人数
I_0 = 1
# E_0为潜伏者的初始人数
E_0 = 0
# R_0为治愈者的初始人数
R_0 = 0
# S_0为易感者的初始人数
S_0 = N - I_0 - E_0 - R_0
# T为传播时间
T = 150
# σ为潜伏者转化为感染者速率
sigama = 0.3

# INI为初始状态下的数组
INI = (S_0,E_0,I_0,R_0)


def funcSEIR(inivalue,_):
    Y = np.zeros(4)
    X = inivalue
    # 易感个体变化
    Y[0] = - (beta * X[0] * X[2]) / N
    # 潜伏个体变化
    Y[1] = (beta * X[0] * X[2]) / N - X[1] * sigama
    # 感染个体变化
    Y[2] = X[1] * sigama - gamma * X[2]
    # 治愈个体变化
    Y[3] = gamma * X[2]
    return Y

T_range = np.arange(0,T + 1)

RES = spi.odeint(funcSEIR,INI,T_range)


plt.plot(RES[:,0],color = 'darkblue',label = 'Susceptible',marker = '.')
plt.plot(RES[:,1],color = 'orange',label = 'Exposed',marker = '.')
plt.plot(RES[:,2],color = 'red',label = 'Infection',marker = '.')
plt.plot(RES[:,3],color = 'green',label = 'Recovery',marker = '.')

plt.title('SEIR Model')
plt.legend()
plt.xlabel('Day')
plt.ylabel('Number')
plt.show()
②考虑潜伏者(E)具有传染性的因素
假设易感染与感染者接触被传播强度为β1,易感染与潜伏着接触被传染强度被β2:


模型六:SEIRS-Model
①原始模型
抗体持续时间为7天,疾病潜伏期为14天:
import scipy.integrate as spi
import numpy as np
import matplotlib.pyplot as plt

# N为人群总数
N = 10000
# β为传染率系数
beta = 0.6
# gamma为恢复率系数
gamma = 0.1
# Ts为抗体持续时间
Ts = 7
# Te为疾病潜伏期
Te = 14
# I_0为感染者的初始人数
I_0 = 1
# E_0为潜伏者的初始人数
E_0 = 0
# R_0为治愈者的初始人数
R_0 = 0
# S_0为易感者的初始人数
S_0 = N - I_0 - E_0 - R_0
# T为传播时间
T = 150

# INI为初始状态下的数组
INI = (S_0,E_0,I_0,R_0)


def funcSEIRS(inivalue,_):
    Y = np.zeros(4)
    X = inivalue
    # 易感个体变化
    Y[0] = - (beta * X[0] * X[2]) / N + X[3] / Ts
    # 潜伏个体变化
    Y[1] = (beta * X[0] * X[2]) / N - X[1] / Te
    # 感染个体变化
    Y[2] = X[1] / Te - gamma * X[2]
    # 治愈个体变化
    Y[3] = gamma * X[2] - X[3] / Ts
    return Y

T_range = np.arange(0,T + 1)

RES = spi.odeint(funcSEIRS,INI,T_range)


plt.plot(RES[:,0],color = 'darkblue',label = 'Susceptible',marker = '.')
plt.plot(RES[:,1],color = 'orange',label = 'Exposed',marker = '.')
plt.plot(RES[:,2],color = 'red',label = 'Infection',marker = '.')
plt.plot(RES[:,3],color = 'green',label = 'Recovery',marker = '.')

plt.title('SEIRS Model')
plt.legend()
plt.xlabel('Day')
plt.ylabel('Number')
plt.show()


