python手动实现图像像素的kmeans聚类(附代码)
1.简介
这篇文章主要是介绍了python使用kmeans算法来对图像中的像素进行聚类。整个kmeans算法为手动实现,不调用sklearn库。一共使用了两种方法,其中方法a.py使用了三通道像素值rgb共三个特征,方法b.py使用了rgb+像素坐标xy共5个特征。
2.kmeans
kmeans步骤共可分为以下步骤:
随机初始化k个聚类中心。
计算所有像素点到聚类中心的距离。
选择最近的聚类中心作为像素点的聚类种类。
根据像素点的聚类种类更新聚类中心。
重复步骤2-4直至聚类中心收敛。
3.代码
部分关键代码:
# 提取图像的像素值
features = []
for y in range(height):
    for x in range(width):
        features.append(image[y, x, :] / 255)
features = np.array(features)
# 初始化聚类中心
kmeans_centers = features[np.random.choice(len(features), k), :]
kmeans_centers = np.array(kmeans_centers)
# 计算所有像素点到聚类中心的距离矩阵
def euclidean_dist(X, Y):
Gx = np.matmul(X, X.T)
Gy = np.matmul(Y, Y.T)
diag_Gx = np.reshape(np.diag(Gx), (-1, 1))
diag_Gy = np.reshape(np.diag(Gy), (-1, 1))
return diag_Gx + diag_Gy.T - 2 * np.matmul(X, Y.T)# 更新聚类中心
new_kmeans_centers = []
for j in range(k):
new_kmeans_centers.append(np.mean(features[segs==j, :], axis=0))
new_kmeans_centers = np.array(new_kmeans_centers)方法a完整代码:
import numpy as np
import matplotlib.pyplot as plt
import matplotlib.image as mpimg

if __name__ == '__main__':
    # Initialize rgb pixel values for each class in kmeans using specific values
    bgr_list = [(0, 0, 255),
                 (0, 255, 0),
                 (255, 0, 0),
                 (128, 128, 255),
                 (128, 255, 128),
                 (255, 128, 128),
                 (128, 0, 255),
                 (128, 255, 0),
                 (255, 128, 0),
                 (0, 128, 255),
                 (0, 255, 128),
                 (255, 0, 128)]
    # Reading images using matplotlib library
    image = mpimg.imread('demo.jpg')
    height, width, channel = image.shape
    # show original image
    plt.figure()
    plt.subplot(3, 3, 1)
    plt.axis('off')
    plt.title('Original')
    plt.imshow(image)
    # do kmeans segmentation
    for i, k in enumerate(range(5, 13, 1)):
        # extract bgr features
        features = []
        for y in range(height):
            for x in range(width):
                features.append(image[y, x, :] / 255)
        features = np.array(features)
        # initial segments center using random value in features
        kmeans_centers = features[np.random.choice(len(features), k), :]
        kmeans_centers = np.array(kmeans_centers)
        # update
        while True:
            # calculate distance matrix
            def euclidean_dist(X, Y):
                Gx = np.matmul(X, X.T)
                Gy = np.matmul(Y, Y.T)
                diag_Gx = np.reshape(np.diag(Gx), (-1, 1))
                diag_Gy = np.reshape(np.diag(Gy), (-1, 1))
                return diag_Gx + diag_Gy.T - 2 * np.matmul(X, Y.T)
            dist_matrix = []
            for start in range(0, len(features), 1000):
                dist_matrix.append(euclidean_dist(features[start:start+1000, :], kmeans_centers))
            dist_matrix = np.concatenate(dist_matrix, axis=0)
            # dist_matrix = euclidean_dist(features, kmeans_centers)
            # get seg class for each sample
            segs = np.argmin(dist_matrix, axis=1)
            # update new kmeans center
            new_kmeans_centers = []
            for j in range(k):
                new_kmeans_centers.append(np.mean(features[segs==j, :], axis=0))
            new_kmeans_centers = np.array(new_kmeans_centers)
            # calculate whether converge
            if np.mean(abs(kmeans_centers - new_kmeans_centers)) < 0.1:
                break
            else:
                kmeans_centers = new_kmeans_centers
        # assign
        segs = segs.reshape(height, width)
        seg_result = np.zeros((height, width, channel), dtype=np.uint8)
        for y in range(height):
            for x in range(width):
                seg_result[y, x, :] = bgr_list[segs[y, x]]

        # show kmeans result
        plt.subplot(3, 3, i+2)
        plt.title('k={}'.format(k))
        plt.axis('off')
        plt.imshow(seg_result)
        plt.savefig('result_a.jpg')
方法b完整代码:
import numpy as np
import matplotlib.pyplot as plt
import matplotlib.image as mpimg

if __name__ == '__main__':
    # Initialize rgb pixel values for each class in kmeans using specific values
    bgr_list = [(0, 0, 255),
                 (0, 255, 0),
                 (255, 0, 0),
                 (128, 128, 255),
                 (128, 255, 128),
                 (255, 128, 128),
                 (128, 0, 255),
                 (128, 255, 0),
                 (255, 128, 0),
                 (0, 128, 255),
                 (0, 255, 128),
                 (255, 0, 128)]
    # Reading images using matplotlib library
    image = mpimg.imread('demo.jpg')
    height, width, channel = image.shape
    # show original image
    plt.figure()
    plt.subplot(3, 3, 1)
    plt.axis('off')
    plt.title('Original')
    plt.imshow(image)
    # do kmeans segmentation
    for i, k in enumerate(range(5, 13, 1)):
        # extract bgr and location features
        features = []
        for y in range(height):
            for x in range(width):
                features.append(np.concatenate((image[y, x, :] / 255, np.array([y / height, x / width])), axis=0))
        features = np.array(features)
        # initial segments center using random value in features
        kmeans_centers = features[np.random.choice(len(features), k), :]
        kmeans_centers = np.array(kmeans_centers)
        # update
        while True:
            # calculate distance matrix
            def euclidean_dist(X, Y):
                Gx = np.matmul(X, X.T)
                Gy = np.matmul(Y, Y.T)
                diag_Gx = np.reshape(np.diag(Gx), (-1, 1))
                diag_Gy = np.reshape(np.diag(Gy), (-1, 1))
                return diag_Gx + diag_Gy.T - 2 * np.matmul(X, Y.T)
            dist_matrix = []
            for start in range(0, len(features), 1000):
                dist_matrix.append(euclidean_dist(features[start:start+1000, :], kmeans_centers))
            dist_matrix = np.concatenate(dist_matrix, axis=0)
            # dist_matrix = euclidean_dist(features, kmeans_centers)
            # get seg class for each sample
            segs = np.argmin(dist_matrix, axis=1)
            # update new kmeans center
            new_kmeans_centers = []
            for j in range(k):
                new_kmeans_centers.append(np.mean(features[segs==j, :], axis=0))
            new_kmeans_centers = np.array(new_kmeans_centers)
            # calculate whether converge
            if np.mean(abs(kmeans_centers - new_kmeans_centers)) < 0.1:
                break
            else:
                kmeans_centers = new_kmeans_centers
        # assign
        segs = segs.reshape(height, width)
        seg_result = np.zeros((height, width, channel), dtype=np.uint8)
        for y in range(height):
            for x in range(width):
                seg_result[y, x, :] = bgr_list[segs[y, x]]

        # show kmeans result
        plt.subplot(3, 3, i+2)
        plt.title('k={}'.format(k))
        plt.axis('off')
        plt.imshow(seg_result)
        plt.savefig('result_b.jpg')
4.结果
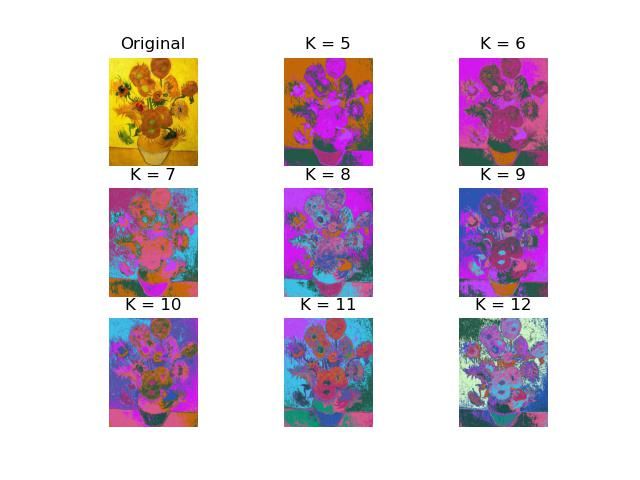
方法a结果
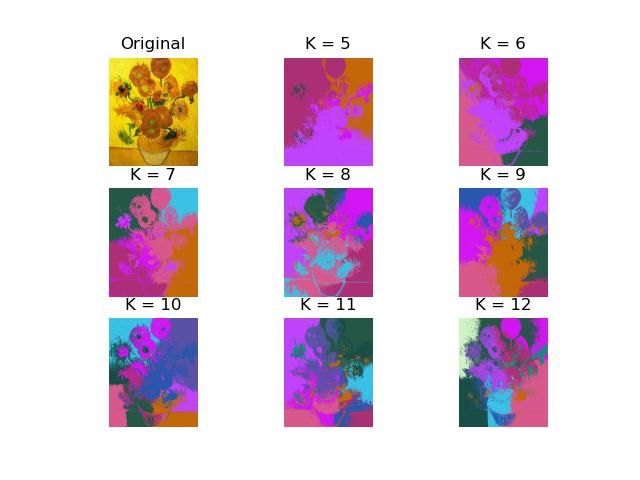
方法b结果
完整的代码可以在我的github上找到:lizhiTech/manual_kmeans: python手动实现图像像素的kmeans聚类 (github.com)
或者csdn下载:python手动实现图像像素的kmeans聚类-机器学习文档类资源-CSDN文库
我们也提供包括深度学习、计算机视觉、机器学习等其他方向的其他代码及辅导服务,有需求可以通过csdn私聊或github上的联系方式联系我们。