02小提琴图加热力图
本文是在模仿中精进数据分析与可视化系列的第一期——小提琴图加热力图,主要目的是参考其他作品模仿学习进而提高数据分析与可视化的能力,如果有问题和建议,欢迎在评论区指出。若有其他想要看的作品,也欢迎在评论区留言或通过公众号发消息给出相关信息。
本文所用的数据和代码可在公众号回复20230106下载,公众号二维码见文末。
一、简介
本次要模仿的作品来自论文Effects of anthropogenic precursor emissions and meteorological conditions on PM2.5 concentrations over the “2+26” cities of northern China ,研究区域为“2+26”城市(京津冀及周边地区),站点级PM2.5浓度数据。
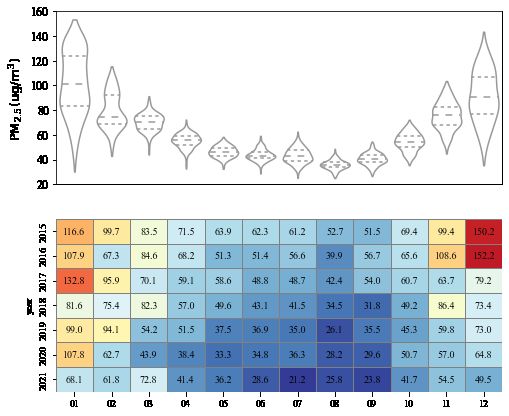
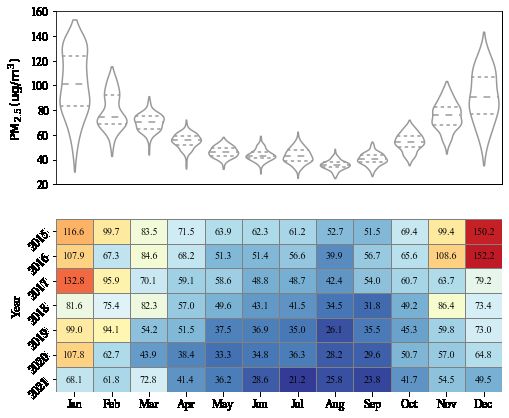
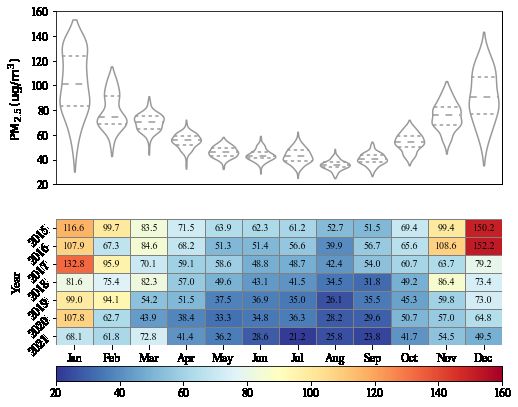
图片分为两个部分,上半部分为研究区域在1-12月的2015-2021年的各个站点的月均PM2.5浓度的小提琴图,下半部分为研究区域2015-2021年每年1-12月的整个研究区域的月均PM2.5浓度。
二、数据准备
本文不再介绍站点级PM2.5数据下载和处理的方法,直接提供数据作为示例,下载方法见文章开头。之后有空会单独写一篇文章详细讲一下怎么处理站点级数据,包括气象数据和污染物数据,有兴趣的可以关注公众号的GIS数据处理系列文章。本文提供的代码和数据示例如下:
+-- 02小提琴图加热力图
|   +-- steps
|   |   +-- 1.png
... ... ... ... ...
|   |   +-- 7.tif
|   +-- plot.ipynb
|   +-- result.png
|   +-- station_month_mean.csv
|   +-- year_month_mean.csv
|
其中,steps下存放各步骤的结果,plot.ipynb为本文所用的代码,result.png为最终的可视化结果,year_month_mean.csv和station_month_mean.csv分别是前文提到的两个数据。
三、可视化
本文会将可视化的步骤拆分开来,分别介绍每个可视化步骤,最后再介绍这个图片的可视化方法。
1)导入所需的包并设置全局字体
import seaborn as sns
import matplotlib.pyplot as plt
from matplotlib import colors, cm

plt.rcParams['font.family'] = 'Times New Roman'
plt.rcParams['axes.unicode_minus'] = False
2)创建子图与画布
fig, (ax1, ax2) = plt.subplots(2, 1, figsize=(8, 7))
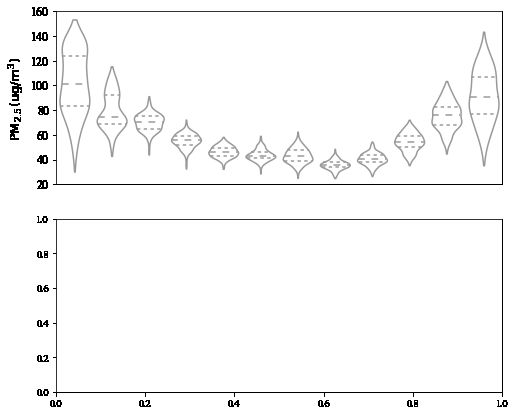
3)绘制小提琴图
sns.violinplot(data=station_month_df, ax=ax1, scale='width', inner='quartile', cut=1, color='w')
4)上子图的刻度标签与轴标签
ax1.set_xticks([])
ax1.set_ylabel('$\mathrm{PM_{2.5}(ug/m^3)}$', fontdict={'fontsize':13})
ax1.set_ylim(20, 160)
ax1.tick_params(axis='y', labelleft='on', left='on', labelsize=12)
5)绘制热力图
im = sns.heatmap(year_month_df, vmin=20, vmax=160, annot=True, fmt='.1f', ax=ax2,
	            linewidths=.5, linecolor="grey", cmap="RdYlBu_r", cbar=False,
	            annot_kws={'color': 'k'})
6)下子图的刻度标签与轴标签
plt.setp(ax2.get_yticklabels(), rotation=45, ha="right", rotation_mode="anchor")
ax2.set_ylabel('Year', fontdict={'fontsize':13})
ax2.set_xticklabels(['Jan', 'Feb', 'Mar', 'Apr', 'May', 'Jun', 'Jul', 'Aug', 'Sep', 'Oct', 'Nov', 'Dec'])
ax2.tick_params(axis='y', labelleft='on', left='on', labelsize=12)
ax2.tick_params(axis='x', labelbottom='on', bottom='on', labelsize=12)
7)热力图色带
cbar = fig.colorbar(cm.ScalarMappable(norm=colors.Normalize(vmin=20, vmax=160), cmap="RdYlBu_r"),
                        ax=ax2, pad=0.12, orientation='horizontal', aspect=30)
cbar.ax.tick_params(labelsize=12)
8)调整子图间距
fig.subplots_adjust(hspace=0.03)
9)保存为图片
fig.savefig('./result.png', dpi=300, bbox_inches='tight')
四、结果展示
学习更多Python & GIS的相关知识,请移步公众号GeodataAnalysis:


