利用lda对文本进行分类
LDA, or Latent Dirichlet Allocation, is one of the most widely used topic modelling algorithms. It is scalable, it is computationally fast and more importantly it generates simple and comprehensible topics that are close to what the human mind assigns when reading a text. While most of the use of LDA is for unsupervised tasks, e.g. topic modelling or document clustering, it can also be used as a feature extraction system for supervised tasks such as text classification. In this article we are going to assemble an LDA based classifier and see how it performs! Let’s go!
LDA或潜在Dirichlet分配是最广泛使用的主题建模算法之一。 它具有可扩展性,计算速度快,更重要的是,它生成简单易懂的主题,这些主题与阅读文本时人脑赋予的主题很接近。 尽管LDA的大多数用途是用于非监督任务,例如主题建模或文档聚类,但它也可以用作监督任务(例如文本分类)的特征提取系统。 在本文中,我们将组装一个基于LDA的分类器,并查看其性能! 我们走吧!
工具: (Tools:)
For simplicity, we’re going to use lda_classification python package, which offers simple wrappers compatible with scikit-learn estimator API for text preprocessing or text vectorization.
为简单起见,我们将使用lda_classification python软件包,该软件包提供与scikit-learn estimator API兼容的简单包装器,用于文本预处理或文本矢量化。
分类问题: (The Classification Problem:)
The 20 News Group dataset is one of the most known and heavily referenced datasets in the field of natural language processing. It consists of around 18K news documents in various categories. For making the task a little less resource heavy, we choose a subset of this dataset for our text classification problem. Since I really like following sports culture, I decided to choose the sport-related section of this dataset. The categories in this subset are as follows:
20新闻组数据集是自然语言处理领域中最著名和引用最多的数据集之一。 它由各种类别的约18K新闻文档组成。 为了使任务少一些资源,我们为文本分类问题选择了该数据集的一个子集。 由于我非常喜欢体育文化,因此我决定选择此数据集中与体育相关的部分。 此子集中的类别如下:
rec.autosrec.motorcyclesrec.sport.baseballrec.sport.hockey设置代码! (Setting up the code!)
Before we run the example we import modules we want:
在运行示例之前,我们需要导入模块:
import logging


import matplotlib.pyplot as plt
import numpy as np
from matplotlib import cm
from sklearn.datasets import fetch_20newsgroups
from sklearn.model_selection import train_test_split
from sklearn.preprocessing import LabelEncoder, StandardScaler
from sklearn.model_selection import (RepeatedStratifiedKFold, cross_val_score, )
from sklearn.pipeline import Pipeline
from sklearn.svm import SVC
from tomotopy import HDPModel


from lda_classification.model import TomotopyLDAVectorizer
from lda_classification.preprocess.spacy_cleaner import SpacyCleaner


#############################################


logging.basicConfig(format='%(asctime)s : %(levelname)s : %(message)s', level=logging.INFO)
workers = 4 #Numbers of workers throughout the project


use_umap = False #make this True if you want to use UMAP for your visualizations


min_df = 5 #Minimum number for document frequency in the corpus
rm_top = 5 #Remove top n frequent words
读取数据集: (Reading the Dataset:)
Loading the dataset with the desired categories is very simple:
加载具有所需类别的数据集非常简单:
labels = ["rec.autos", "rec.motorcycles", "rec.sport.baseball", "rec.sport.hockey"]
raw_docs, y = fetch_20newsgroups(subset='all', return_X_y=True, categories=labels)
The dataset consists of 3979 documents, and the distribution of different classes in this set is shown in the table below:
该数据集包含3979个文档,下表中显示了该组中不同类的分布:
╔════════════════════╦════════╗
║      category      ║  count ║
╠════════════════════╬════════╣
║ rec.autos          ║    999 ║
║ rec.motorcycles    ║    990 ║
║ rec.sport.baseball ║    996 ║
║ rec.sport.hockey   ║    994 ║
╚════════════════════╩════════╝
预处理: (Preprocessing:)
Before processing any data we should make sure that our data is suitable for our algorithms and processes. Taking a look at the data we can clearly see that there is a lot of contextual noise amongst the data. Here is a snippet of one of the documents available in this dataset:
在处理任何数据之前,我们应确保我们的数据适合我们的算法和流程。 查看数据,我们可以清楚地看到数据之间存在很多上下文干扰。 这是此数据集中可用文档之一的片段:
From: [email protected] (Greg  Ballentine)
Subject: Re: plus minus stat
Nntp-Posting-Host: hudson.uvic.ca
Reply-To: [email protected]
Organization: University of Victoria, Victoria, BC, Canada
Lines: 24In article [email protected], [email protected] () writes:
>In article <[email protected]>, [email protected] (Greg  Ballentine) writes:
>>
>>
>> +/- is a good stat because it is the only stat that I am aware of that
>> takes into account defensive play.  It isn't a measure of defensive
>> play- it takes into account offense and defence- all aspects of play.
>
>  If we are interested of real all-round players, the power play stats
>  should be considered, too. Because the power play is also one aspect
>  of play! There is still something to be done with these player evaluation
>  tools!!IMO any good player should score on power plays because of the man
advantage.  Very good power play scorers tend to become overrated
because their point totals are inflated by power play points.
+/- tends to expose these overrated players such as Brett Hull,
John Cullen and Dave Andreychuck.Given the opportunity to play power play consistently, any player can
inflate his totals.Gregmeister
As you can see there are a lot of symbols, links and email-like phrases in this snippet. These kinds of phrases/words are noises to the overall meaning of the documents and should be filtered. The filtering pipeline is as follows:
如您所见,此代码段中包含许多符号,链接和类似电子邮件的短语。 这些类型的短语/单词对文档的整体含义造成干扰,应进行过滤。 过滤管道如下:
1 — Tokenizing the text.
1-标记文本。
2 — Stripping tags, multiple white spaces, punctuations, numeric characters, and short words from the text.
2-从文本中剥离标签,多个空格,标点符号,数字字符和短词。
3 — Remove stop words from the text.(Removing meaningless words)
3-从文本中删除停用词。(删除无意义的词)
4 — Stemming or lemmatizing the tokens.
4-阻止或限制令牌。
In order to do this, we simply utilize SpacyCleaner class from lda_classification that uses spacy with multiprocessing to filter and lemmatize text tokens.
为了做到这一点,我们简单地利用SpacyCleaner类, lda_classification将spacy与多处理结合使用,以过滤和标记文本标记。
processor = SpacyCleaner(chunksize=1000, workers=workers)
docs = processor.transform(raw_docs)
After preprocessing the data, we can see how our first document has changed. See the result of the above mentioned unprocessed document below:
在对数据进行预处理之后,我们可以看到我们的第一个文档如何更改。 请参见下面上述未处理文档的结果:
uvic greg ballentine subject plus minus stat nntp posting host reply uvic organization university victoria victoria canada lines article write article uvic uvic greg ballentine write good stat stat aware take account defensive play measure defensive take account offense aspect play interest real round player power play stats consider power play aspect play player evaluation tool good player score power play advantage good power play scorer tend overrate point total inflate power play point tend expose overrate player brett hull john cullen dave andreychuck given opportunity play power play consistently player inflate total gregmeisterThe preprocessed documents might not make sense to the human mind, but without the punctuation noise and stop-words, the document is prepared to be fed into a feature extractor model.
预处理过的文档可能对人的大脑没有意义,但是如果没有标点符号和停用词,则可以将文档准备好放入特征提取器模型中。
We also need to split the train/test documents and their labels:
我们还需要拆分训练/测试文档及其标签:
docs_train, docs_test, y_train, y_test = train_test_split(docs, y, test_size=0.1, shuffle=True)训练LDA模型: (Training an LDA Model:)
Since we’re going to use LDA for our document vectorization, we need to first train a sufficiently good LDA model to extract the best features possible of our data. To do so we need to find what is the optimal number of topics for our LDA model trained on this corpus. There are two strategies to tackle this problem:
由于我们将使用LDA进行文档矢量化,因此我们需要首先训练一个足够好的LDA模型以提取数据的最佳功能。 为此,我们需要找到在该语料库上训练的LDA模型的最佳主题数。 有两种解决此问题的策略:
1 — Grid search for different number of topics and evaluate each using a coherence metric. (Slow as a snail, and there are other parameters that need to tuned too, such as the number of words in the model’s dictionary.)
1-网格搜索不同数量的主题,并使用一致性度量标准对每个主题进行评估。 (像蜗牛一样慢,还有其他一些参数也需要调整,例如模型字典中的单词数。)
2 — An approach I read in a great Medium article, which utilized HDP (Hierarchical Dirichlet Process) to roughly estimate how many topics exist within our corpus.(Fast)
2 —我在一篇出色的中型文章中读到了一种方法,该方法利用HDP(分级Dirichlet过程)粗略估计了我们的语料库中存在多少个主题。(快速)
I go by the second approach in order to save time, but if you have enough resources, give the first option a try after finding out the range of the number of topics using HDP. I used tomotopy for this approach, because of the fast and robust implementation of HDP and Gensim’s HDP was not converging on my data.
为了节省时间,我采用第二种方法,但是如果您有足够的资源,请在使用HDP确定主题数量范围后尝试第一种方法。 我对这种方法使用了tomotopy ,因为HDP的实现快速且可靠,而Gensim的HDP并未收敛于我的数据。
hdp_model = HDPModel(min_df=min_df, rm_top=rm_top)
hdp_model.optim_interval = 5
for d in docs_train:
    hdp_model.add_doc(d)
hdp_model.burn_in = 100
hdp_model.train(0, workers=workers)
for i in range(0, 1000, 10):
    hdp_model.train(10, workers=workers)
    print('Iteration: {}\tLog-likelihood: {}\tNum. of topics: {}'.format(i, hdp_model.ll_per_word, hdp_model.live_k))


num_of_topics = hdp_model.live_k
After finding out the number of topics, we can train our own LDAVectorizer model. Again I use Tomotopy’s LDAModel since it converges faster on my data.
在找到主题数量之后,我们可以训练自己的LDAVectorizer模型。 再次使用Tomotopy的LDAModel,因为它在数据上的收敛速度更快。
vectorizer = TomotopyLDAVectorizer(num_of_topics=num_of_topics,
workers=workers, min_df=min_df,
rm_top=rm_top)
x_train = vectorizer.fit_transform(docs_train)
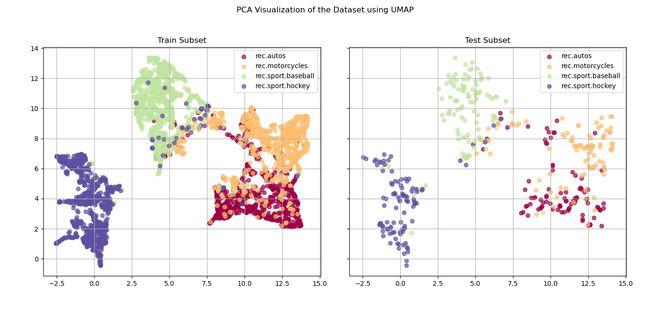
x_test = vectorizer.transform(docs_test)In order to see how these sets of features are helping us to discriminate between the classes, using UMAPlibrary we reduce our 12 features dimension to 2D in order to visualize the data.
为了了解这些功能集如何帮助我们区分这些类,使用UMAP库,我们将12个特征的维数减小为2D,以便可视化数据。
def plot_topic_clusters(ax, x2d, y, labels):
    ax.set_aspect("equal")
    colors = cm.get_cmap("Spectral", len(labels))
    for i, l in enumerate(labels):
        c = colors(i / len(labels))
        ax.scatter(x2d[y == i, 0], x2d[y == i, 1], color=c, label=l, alpha=0.7)
    ax.grid()
    ax.legend()
    ax.set(adjustable='box', aspect='equal')
    return ax


title = "PCA Visualization of the Dataset using {}"
if use_umap is True:
    from umap import UMAP
    dim_reducer = UMAP(n_components=2)
    title = title.format("UMAP")
else:
    from sklearn.manifold import TSNE
    dim_reducer = TSNE(n_components=2)
    title = title.format("TSNE")


x_transform = np.concatenate((x_train, x_test))
x_transform = StandardScaler().fit_transform(x_transform)
x_transform = dim_reducer.fit_transform(x_transform)


x2d_train = x_transform[:x_train.shape[0], :]
x2d_test = x_transform[x_train.shape[0]:, :]


fig, axes = plt.subplots(ncols=2, sharex=True, sharey=True)
plot_topic_clusters(axes[0], x2d_train, y_train, labels)
plot_topic_clusters(axes[1], x2d_test, y_test, labels)
axes[0].set_title("Train Subset")
axes[1].set_title("Test Subset")
fig.suptitle(title)
plt.tight_layout()
plt.show()
You can see the result of the visualization in the image below. Both the training set and the test set are behaving roughly the same. As you can see automobiles and motorcycles are the two categories with the most overlap in the projected feature map, which was expected.
您可以在下图中看到可视化的结果。 训练集和测试集的行为大致相同。 如您所见,在预期的特征地图中,汽车和摩托车是重叠度最高的两个类别。
Since we have found a good number of topics for our LDA model, which is roughly around 15 topics with minor deviations between different runs, we can now train a classifier. The classifier of our choice is SVM with a linear kernel. For evaluation of the classifier we use RepeatedStratifiedKFold cross validation approach, and we use scikit-learn‘s Pipeline module to stack multiple transformers/estimators together to facilitate our cross validation procedutre. Also, it’s important to note that since SVM expects standard data, we should preprocess the data matrix before feeding it to the SVM module.
由于我们为LDA模型找到了很多主题,大约15个主题,不同运行之间的差异很小,因此我们现在可以训练分类器。 我们选择的分类器是带有线性核的SVM。 为了评估分类器,我们使用RepeatedStratifiedKFold交叉验证方法,并且使用scikit-learn的Pipeline模块将多个变换器/估计器堆叠在一起,以方便进行交叉验证。 另外,必须注意的是,由于SVM需要标准数据,因此我们应该在将数据矩阵提供给SVM模块之前对其进行预处理。
folds = RepeatedStratifiedKFold(n_splits=10, n_repeats=10)
vectorizer = TomotopyLDAVectorizer(num_of_topics=15, workers=workers, min_df=min_df,
                                   rm_top=rm_top)
clf = SVC()
pca = PCA(n_components=0.95)
pipe = Pipeline([("vectorizer", vectorizer), ("scalar", StandardScaler()),
                 ("classifier", clf)])


results = cross_val_score(pipe, docs, y_true, cv=folds, n_jobs=2, verbose=1,
                          scoring="accuracy")


print("Accuracy -> mean: {}\t std: {}".format(results.mean(), results.std()))
Running this results in an average accuracy of %90.26 with a standard deviation of %1.58. Not bad, isn’t it? For more information about the lda_classification package and more examples, you can check out the package’s repository on GitHub. The code to this project is broken into two code snippets in the example folder (Visualization and Classification).
运行此命令可获得的平均精度为%90.26 ,标准偏差为%1.58。 还不错,不是吗? 有关lda_classification更多信息 包和更多示例,您可以在GitHub上查看该包的存储库 。 该项目的代码在example文件夹( 可视化和分类 )中分为两个代码段。
P.S: I am Farhood Etaati, a machine learning enthusiast and I like to tackle fun project ideas. If you had an interesting idea, feel free to comment below!
PS:我是Farhood Etaati,机器学习爱好者,我喜欢解决有趣的项目构想。 如果您有有趣的想法,请在下面发表评论!
翻译自: https://medium.com/analytics-vidhya/text-classification-using-lda-35d5b98d4f05
利用lda对文本进行分类