Kaggle数据科学竞赛使用GBDT、XGBoost、Lightgbm方法预测是否可以成功申请经费
数据科学与机器学习案例之客户的信用风险与预测
数据科学与机器学习案例之信用卡欺诈识别(严重类失衡数据建模)
数据科学与机器学习案例之汽车目标客户销售策略研究
数据科学与机器学习案例之WiFi定位系统的位置预测
数据科学与机器学习案例之Stacking集成方法对鸢尾花进行分类
数据科学案例之生存分析与二手车定价
Kaggle数据科学竞赛使用GBDT、XGBoost、Lightgbm方法预测是否可以成功申请经费
- 数据介绍
- 数据处理
- GBDT算法
- XGBoost算法
数据介绍
数据来源于Kaggle数据科学竞赛,数据下载地址为:Kaggle数据下载链接.
竞赛题目为:预测经费申请是否能够得到批准.

此数据集包括
249此数据集包括 249 个要素(或预测变量)。参与者应使用这些变量来预测目标变量(或结果)“授予状态”。授权状态1表示授权申请成功,而授权状态0表示申请不成功。
参与者用来构建模型的训练数据集unimelb_training.csv。它包含2005年底至2008年的8707份赠款申请。测试数据集unimelb_test.csv,包含从2009年到2010年中2176份拨款申请。从测试数据集中保留授予状态变量。
预测应采用与unimelb_example.csv相同的格式(一个包含2176行的 CSV 文件,第一列中有一个授予应用程序ID,第二列中的成功概率介于0和1之间)。
该大学提供了以下功能:
赞助商代码:用于代表不同赞助商的ID
资助类别代码:赞助商的分类(例如澳大利亚竞争性资助,合作研究中心,行业)
合同价值范围:资助的价值(见下面的关键)
开始日期:提交资助申请的日期
RFD代码:研究领域,课程和学科分类(参见定义)
RFCD 百分比:如果有多个与项目
相关的 RFCD 代码 SEO 代码:社会经济目标分类(参见定义)
SEO 百分比:如果有多个与项目
相关的 SEO 代码人员 ID:调查人员的唯一 ID
角色:调查人员在研究中的角色
出生年份:调查员的出生年份(四舍五入到最接近的五年间隔)
出生国家:调查员的出生国(通常按大洲汇总)
母语:调查员的母语(分为英语和其他)
部门编号:调查员的部门
教师编号:调查员的教师
年级:调查员的资历级别
在Uni的年数:调查员在提出资助申请时在墨尔本大学的年数
成功授予的次数:调查员提出的成功资助申请的次数
不成功的资助次数:调查员提出的不成功的资助申请的次数
A*: A* 期刊文章数
A: A 期刊文章数
B: B 期刊文章数
C: C 期刊文章数.
参与者应使用这些变量来预测目标变量(此数据集包括249个要素(或预测变量)。参与者应使用这些变量来预测目标变量(或结果)“授予状态”。授权状态1表示授权申请成功,而授权状态0表示申请不成功。
对于语言的选择这里使用的是R语言.
数据处理
构建模型的第一步需要对原始的数据进行处理,我们需要从原始的数据中提取出模型可以识别的特征,即特征工程.需要从原始的数据中抽取出合适的预测变量,从而选择出合适的模型进行预测.
分析步骤:
- 以下介于思维导图的篇幅原因只展示了部分预测变量的处理技术。

> library(plyr)
> library(caret)
> library(lubridate)
> library(doParallel)
> library(Hmisc)
> data.train = read.csv('unimelb_training.csv')
> describe(data.train[,1:15])
> table(data.train$Sponsor.Code,exclude = NULL)
> data.train$Sponsor.Code[data.train$Sponsor.Code == ''] = 'Unk'
> data.train$Sponsor.Code = factor(paste('Sponsor.Code',data.train$Sponsor.Code,
+                                   sep = ''))
>
> table(data.train$Grant.Category.Code,exclude = NULL)
> data.train$Grant.Category.Code[data.train$Grant.Category.Code == ''] = 'Unk'
> data.train$Grant.Category.Code = factor(paste('Grant.Category.Code',data.train$Grant.Category.Code,
+                                   sep = ''))
>
> table(data.train$Contract.Value.Band...see.note.A)
>data.train$Contract.Value.Band...see.note.A[data.train$Contract.Value.Band...see.note.A
+       == ''] = 'Unk'
> data.train$Contract.Value.Band...see.note.A = factor(
+          paste('Contract.Value.Band...see.note.A',data.train$Contract.Value.Band...see.note.A,
+                sep = ''))
>
> temp = grep('Role',names(data.train),value = F)
> A = vector(mode = 'list',length = length(temp))
> for(i in 1:length(temp)){
+      A[[i]] = table(data.train[,temp[i]])} # 每个Role中都有空值
>
> data.train$Role.1[data.train$Role.1 == ''] = 'Unk' # 将Role.1中的空值进行了替换
>
> birth.year = unique(do.call('c',
+               data.train[,grep('Year.of.Birth',names(data.train),value = F)]))
> birth.year = birth.year[! is.na(birth.year)] # 去重所有申请者的出生年月
>
> dept.no = unique(do.call('c',
+               data.train[,grep('Dept.No',names(data.train),value = F)]))
> dept.no = dept.no[! is.na(dept.no)] # 去重所有申请者的部门编号
>
>
> A = vector(mode = 'list',length = 15)
> for(i in 1:length(A)){
+       a = data.train[,c('Grant.Application.ID',grep(paste('\\.',i,'$',sep = ''),names(
+                           data.train),value = T))]
+       names(a) = gsub(paste('\\.',i,'$',sep = ''),'',names(a))
+       if(i == 1) name = names(a)
+
+       if(all(names(a) != 'RFCD.Code')) a$RFCD.Code = NA
+       if(all(names(a) != 'RFCD.Percentage')) a$RFCD.Percentage = NA
+       if(all(names(a) != 'SEO.Code')) a$SEO.Code = NA
+       if(all(names(a) != 'SEO.Percentage')) a$SEO.Percentage = NA
+
+       A[[i]] = a[,name]
+       rm(a)
+                       }
>
> A[which(A$Role == '')[1:10],] # 查看Role为空值的数据框
> A2 = subset(A,Role != '')
> A = A2
> A$Role = factor(A$Role)
> A$Year.of.Birth = factor(A$Year.of.Birth,levels = sort(birth.year))
>
> table(A$Country.of.Birth)
> A$Country.of.Birth[A$Country.of.Birth == ''] = NA
> A$Country.of.Birth = factor(A$Country.of.Birth)
>
> table(A$Home.Language)
> A$Home.Language[A$Home.Language == ''] = NA
> A$Home.Language = factor(A$Home.Language)
>
> table(A$Dept.No.,exclude = NULL)
> A$Dept.No. = paste('Dept.No.',A$Dept.No.,sep = '')
> A$Dept.No.[A$Dept.No. == 'Dept.No.NA'] = NA
> A$Dept.No. = factor(A$Dept.No.)
>
> table(A$Faculty.No.,exclude = NULL)
> A$Faculty.No. = paste('Faculty.No.',A$Faculty.No.,sep = '')
> A$Faculty.No.[A$Faculty.No. == 'Faculty.No.NA'] = NA
> A$Faculty.No. = factor(A$Faculty.No.)
> A$RFCD.Code = paste('RFCD.Code.',A$RFCD.Code,sep = '')
> A$RFCD.Percentage[A$RFCD.Code == 'RFCD.Code.NA'] = NA
> A$RFCD.Percentage[A$RFCD.Code == 'RFCD.Code.0'] = NA
> A$RFCD.Percentage[A$RFCD.Code == 'RFCD.Code.999999'] = NA
> A$RFCD.Code[A$RFCD.Code == 'RFCD.Code.NA'] = NA
> A$RFCD.Code[A$RFCD.Code == 'RFCD.Code.0'] = NA
> A$RFCD.Code[A$RFCD.Code == 'RFCD.Code.999999'] = NA
> A$RFCD.Code = factor(A$RFCD.Code)
>
> table(A$SEO.Code,exclude = NULL)
> A$SEO.Code = paste('SEO.Code.',A$SEO.Code,sep = '')
> A$SEO.Percentage[A$SEO.Code == 'SEO.Code.NA'] = NA
> A$SEO.Percentage[A$SEO.Code == 'SEO.Code.0'] = NA
> A$SEO.Percentage[A$SEO.Code == 'SEO.Code.999999'] = NA
> A$SEO.Code[A$SEO.Code == 'SEO.Code.NA'] = NA
> A$SEO.Code[A$SEO.Code == 'SEO.Code.0'] = NA
> A$SEO.Code[A$SEO.Code == 'SEO.Code.999999'] = NA
> A$SEO.Code = factor(A$RFCD.Code)
>
> table(A$No..of.Years.in.Uni.at.Time.of.Grant,exclude = NULL)
> A$No..of.Years.in.Uni.at.Time.of.Grant[A$No..of.Years.in.Uni.at.Time.of.Grant ==
+      ''] = 'durationUnk'
> A$No..of.Years.in.Uni.at.Time.of.Grant[A$No..of.Years.in.Uni.at.Time.of.Grant ==
+      'Less than 0'] = 'durationLT0'
> A$No..of.Years.in.Uni.at.Time.of.Grant[A$No..of.Years.in.Uni.at.Time.of.Grant ==
+      'more than 15'] = 'durationGT15'
> A$No..of.Years.in.Uni.at.Time.of.Grant[A$No..of.Years.in.Uni.at.Time.of.Grant ==
+      '>5 to 10'] = 'duration5to10'
> A$No..of.Years.in.Uni.at.Time.of.Grant[A$No..of.Years.in.Uni.at.Time.of.Grant ==
+      '>=0 to 5'] = 'duration0to5'
> A$No..of.Years.in.Uni.at.Time.of.Grant[A$No..of.Years.in.Uni.at.Time.of.Grant ==
+      '>10 to 15'] = 'duration10to15'
> A$No..of.Years.in.Uni.at.Time.of.Grant = as.factor(
+                 A$No..of.Years.in.Uni.at.Time.of.Grant)
>
> names.short = function(x,pre = ''){
+       x = gsub('EXT_CHIEF_INVESTIGATOR','ECI',x)
+       x = gsub('STUD_CHIEF_INVESTIGATOR','SCI',x)
+       x = gsub('CHIEF_INVESTIGATOR','CI',x)
+       x = gsub('DELEGATED_RESEARCHER','DR',x)
+       x = gsub('EXTERNAL_ADVISOR','EA',x)
+       x = gsub('HONVISIT','HV',x)
+       x = gsub('PRINCIPAL_SUPERVISOR','PS',x)
+       x = gsub('STUDRES','SR',x)
+       x = gsub('Unk','UNK',x)
+       other = x[x != 'Grant.Application.ID']
+       c('Grant.Application.ID',paste(other,sep = ''))} # 简化处理Role的字段
>
> # 统计每个ID下的参与人数
> people = ddply(A,.(Grant.Application.ID),function(x){
+              numpeople = nrow(x)})
> people1 = ddply(A,.(Grant.Application.ID),function(x){
+               out = as.data.frame(t(as.matrix(table(x$Role))))
+               out})
> people2 = ddply(A,.(Grant.Application.ID),function(x){
+                out = as.data.frame(table(x$Role,x$Year.of.Birth))
+                out1 = data.frame(t(out$Freq))
+                names(out1) = paste(out$Var1,out$Var2,sep = '')
+                out1   })
> people3 = ddply(A,.(Grant.Application.ID),function(x){
+             out = as.data.frame(table(x$Role,x$Country.of.Birth))
+             out1 = data.frame(t(out$Freq))
+             names(out1) = paste(out$Var1,out$Var2,sep = '')
+             out1})
> people4 = ddply(A,.(Grant.Application.ID),function(x){
+             out = as.data.frame(table(x$Role,x$Home.Language))
+             out1 = data.frame(t(out$Freq))
+             names(out1) = paste(out$Var1,out$Var2,sep = '')
+             out1})
> people5 = ddply(A,.(Grant.Application.ID),function(x){
+              out = as.data.frame(table(x$Role,x$With.PHD))
+              out1 = data.frame(t(out$Freq))
+              names(out1) = paste(out$Var1,out$Var2,sep = '.')
+              out1})
> names(people5) = names.short(names(people5))
> people5 = people5[,-grep('\\.$',names(people5))]
> people5[is.na(people5)] = 0
>
> # 统计每个角色以及ID下的申请成功率与不成功的频数
> people6 = ddply(A,.(Grant.Application.ID,Role),function(x){
+                 data.frame(Success = sum(x$Number.of.Successful.Grant),
+                      Unsuccess = sum(x$Number.of.Unsuccessful.Grant))  })
>
> # 统计每个角色与部门所在的频数
> people6 = ddply(A,.(Grant.Application.ID),function(x){
+              out = as.data.frame(table(x$Role,x$Dept.No.))
+              out1 = data.frame(t(out$Freq))
+              names(out1) = paste(out$Var1,out$Var2,sep = '')
+              out1})
> names(people6) = names.short(names(people6))
>
> # 统计每个角色与职业所在的频数
> people7 = ddply(A,.(Grant.Application.ID),function(x){
+             out = as.data.frame(table(x$Role,x$Faculty.No.))
+              out1 = data.frame(t(out$Freq))
+              names(out1) = paste(out$Var1,out$Var2,sep = '')
+              out1})
> names(people7) = names.short(names(people7))
>
> # 统计每个ID下的工作年限
> people8 = ddply(A,.(Grant.Application.ID),function(x){
+              as.data.frame(t(as.matrix(
+          table(x$No..of.Years.in.Uni.at.Time.of.Grant)))) })
>
> # 统计每个ID下的发表论文的数量
> people9 = ddply(A,.(Grant.Application.ID),function(x){
+             data.frame(AstarTotal = sum(x$A.,na.rm = T),
+                        ATotal = sum(x$A,na.rm = T),
+                        BTotal = sum(x$B,na.rm = T),
+                        CTotal = sum(x$C,na.rm = T),
+                        allTotal = sum(c(x$A.,x$A,x$B,x$C),na.rm = T))})
> # 统计每个ID和角色下的论文发表数量
> people10 = ddply(A,.(Grant.Application.ID,Role),function(x){
+                data.frame(Astar = sum(x$A.,na.rm = T),
+                        A = sum(x$A,na.rm = T),
+                        B = sum(x$B,na.rm = T),
+                        C = sum(x$C,na.rm = T),
+                        allTotal = sum(c(x$A.,x$A,x$B,x$C),na.rm = T)) })
> people10 = reshape(people10, direction = "wide",
+         idvar = "Grant.Application.ID", timevar = "Role")
> # 统计每个ID下面的RFCD.Code
> people11 = ddply(A,.(Grant.Application.ID),function(x){
+             as.data.frame(t(as.matrix(table(x$RFCD.Code))))})
> # 统计每个ID下面的SEO.Code
> people12 = ddply(A,.(Grant.Application.ID),function(x){
+              as.data.frame(t(as.matrix(table(x$SEO.Code))))})
>
>
> # 移除每个数据框下的近邻方差变量
> near.zero = function(data){
+        keep = unlist(lapply(data,function(x)length(unique(x)) > 1))
+        return(data[,keep,drop = F])}
>
> people1 = near.zero(people1)
> people2 = near.zero(people2)
> grantData <- data.train[, c("Sponsor.Code", "Contract.Value.Band...see.note.A", "Grant.Category.Code")]
>
> startTime <- dmy(data.train$Start.date) # 对时间进行处理(选取来自05-08年的数据)
>
> grantData$Month <- factor(as.character(month(startTime,label = T)))
> grantData$Weekday <- factor(as.character(wday(startTime,label = T)))
> grantData$Day <- day(startTime)
> grantYear <- year(startTime)
>
> dummies <- dummyVars(~., data = grantData, levelsOnly = TRUE)
> grantData <- as.data.frame(predict(dummies, grantData))
> names(grantData) <- gsub(" ", "", names(grantData))
>
> grantData$Grant.Application.ID <- data.train$Grant.Application.ID
> grantData$Class <- factor(ifelse(data.train$Grant.Status, "successful", "unsuccessful"))
>
> grantData$is2008 <- year(startTime) == 2008
> grantData <- near.zero(grantData)
>
> Summaried <- merge(people,people1)
> Summaried <- merge(Summaried,people2)
> Summaried <- merge(Summaried,people3)
> Summaried <- merge(Summaried,people4)
> Summaried <- merge(Summaried,people5)
> Summaried <- merge(Summaried,people6)
> Summaried <- merge(Summaried,people7)
> Summaried <- merge(Summaried,people8)
> Summaried <- merge(Summaried,people9)
> Summaried <- merge(Summaried,people10)
> Summaried <- merge(Summaried,people11)
> Summaried <- merge(Summaried,people12)
> Summaried1 <- merge(Summaried,grantData)
> Summaried <- Summaried1
以下是四种boosting方法的调参。GBDT、XGBoost在R语言caret框架下已经完备,调参过程可直接使用train函数进行训练。
lightgbm与catboost不在caret框架中,两种算法的调参手动实现。
GBDT算法
library(caret)

train.index = createDataPartition(Summaried$Class,p = .75,list = T)[[1]]
df.train = Summaried[train.index,]
df.test = Summaried[-train.index,]

corrplot::corrplot(cor(Summaried[,1:67]),order = 'hclust',type='full',
                   tl.cex = .3) # 可视化相关系数图

library(gbm)
help(package = 'gbm')


str(df.train)
df.train = df.train[,-(ncol(df.train) - 1)]
df.train$Class = ifelse(df.train$Class == 'successful',1,0)

gbm1 = gbm(Class ~.,data = df.train,
           distribution = 'bernoulli',
           interaction.depth = 9,
           n.trees = 1400,shrinkage = .01,
           verbose = F)
gbmTune = expand.grid(interaction.depth = c(1,3,5,7,9),
                      n.trees = c(500,1000,1500,2000),
                      shrinkage = c(.01,.1),
                      n.minobsinnode = c(10,20))

ctrl = trainControl(method = 'cv',number = 5,
                    summaryFunction = twoClassSummary,
                    classProbs = T,
                   savePredictions = TRUE)

df.train$Class = factor(ifelse(df.train$Class == 1,'successful','unsuccessful'))
set.seed(1230)
gbm.model = train(x = df.train[,1:67],
                  y = df.train$Class,
                  method = 'gbm',
                  tuneGrid = gbmTune,
                  metric = 'ROC',
                  verbose = F,trControl = ctrl)

summary(gbm.model)

attach(gbm.model)
bestTune
subset(results,n.trees == 2000 & interaction.depth == 9 & shrinkage == .01 &
     n.minobsinnode == 10)

plot(gbm.model)

df.test = df.test[,-(ncol(df.test) - 1)]

df.test.raw = predict(gbm.model,newdata = df.test[,1:(ncol(df.test) - 1)],
                type = 'raw')

df.test.prob = predict(gbm.model,newdata = df.test[,1:(ncol(df.test) - 1)],
                type = 'prob')

df.test.pre = data.frame(df.test.raw,df.test.prob)

gbdt.det.test = as.data.frame(caret::confusionMatrix(data = df.test.pre$df.test.raw,
                       reference = df.test$Class)$table) # 测试集中的混淆矩阵

df.train.raw = predict(gbm.model,newdata = df.train[,1:67],type = 'raw')
df.train.prob = predict(gbm.model,newdata = df.train[,1:67],type = 'prob')
df.train.pre = data.frame(df.train.raw,df.train.prob)

gbdt.det.train = as.data.frame(caret::confusionMatrix(data = df.train.pre$df.train.raw,
                       reference = df.train$Class)$table)

library(ggplot2)
ggplot(gbdt.det.test,aes(x = Prediction,y = Reference,fill = Freq))+
geom_tile()+
geom_text(aes(label = Freq))+
scale_fill_gradient(low = "green", high = "red")


XGBoost算法
xgboostTune = expand.grid(nrounds = c(10,25,50),
max_depth = c(5,7,9),
eta = c(.01,.05,.1),
gamma = c(0.01, 0.015, 0.025, 0.05, 0.1),
colsample_bytree = 1,
min_child_weight = c(.8,1),
subsample = 1 )
ctrl = trainControl(method = 'cv',number = 5,
summaryFunction = twoClassSummary,
classProbs = T,
savePredictions = TRUE,allowParallel = TRUE)
library(doParallel)
cl <- makePSOCKcluster(10)
registerDoParallel(cl)
set.seed(1900)
xgboost.model = train(Class ~.,data = df.train,
method = 'xgbTree',
tuneGrid = xgboostTune,
trControl = ctrl,
metric = 'ROC',
verbose = F)
stopCluster(cl)
plot(xgboost.model)
df.train.raw = predict(xgboost.model,newdata = df.train[,1:67],
type = 'raw')
df.train.prob = predict(xgboost.model,newdata = df.train[,1:67],
type = 'prob')
df.train.pre = data.frame(df.train.raw,df.train.prob)
df.test.raw = predict(xgboost.model,newdata = df.test[,1:67],
type = 'raw')
df.test.prob = predict(xgboost.model,newdata = df.test[,1:67],
type = 'prob')
df.test.pre = data.frame(df.test.raw,df.test.prob)
xgboost.det.train = as.data.frame(
confusionMatrix(df.train.pre$df.train.raw,df.train$Class)$table)
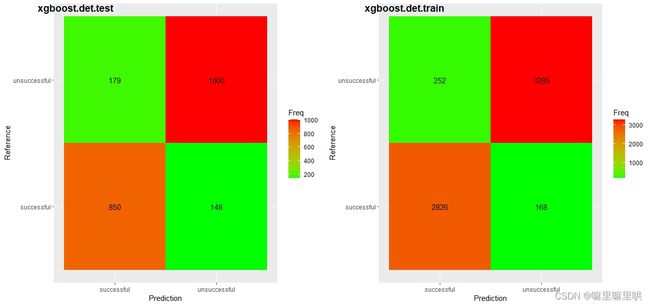
xgboost.det.test = as.data.frame(
confusionMatrix(df.test.pre$df.test.raw,df.test$Class)$table)
p1 = ggplot(xgboost.det.test,aes(x = Prediction,y = Reference,fill = Freq))+
geom_tile()+
geom_text(aes(label = Freq))+
scale_fill_gradient(low = "green", high = "red")
p2 = ggplot(xgboost.det.train,aes(x = Prediction,y = Reference,fill = Freq))+
geom_tile()+
geom_text(aes(label = Freq))+
scale_fill_gradient(low = "green", high = "red")
library(cowplot)
plot_grid(p1, p2,
labels = c("xgboost.det.test", "xgboost.det.train"),
ncol = 2, nrow = 1)

以上就是关于GBDT、XGBoost在Kaggle数据科学竞赛中的应用,另外lightgbm方法在这里就不展示了,感兴趣的朋友可以参考以下链接:Lightgbm使用教程.
最后祝愿各位大佬1024节日快乐.