【Spikingjelly】SNN框架教程的代码解读_4
Spikingjelly
- 时间驱动:使用单层全连接SNN识别MNIST
-
- 训练SNN网络
- 观察结果
-
- a. 训练测试正确率
- b. 测试图片与发放脉冲
- c. 训练好的模型脉冲发放和电压
- 时间驱动:使用卷积SNN识别Fashion-MNIST
-
- 卷积网络搭建
- 训练SNN卷积网络
- 可视化编码器
- 思考
- 参考
时间驱动:使用单层全连接SNN识别MNIST
clock_driven.examples.lif_fc_mnist.py在该系列文章第一篇中做过分析,里面介绍了双层LIF神经元的阈下动态方程和代码实现,参考链接:
【Spikingjelly】SNN框架教程的代码解读.
这一节比较简单,回顾单层SNN用编码器与替代梯度方法训练一个最简单的MNIST分类网络。
训练SNN网络
训练代码的编写需要遵循以下三个要点:
A. 脉冲神经元的输出是二值的,而直接将单次运行的结果用于分类极易受到干扰。因此一般认为脉冲网络的输出是输出层一段时间内的发放频率(或称发放率),发放率的高低表示该类别的响应大小。因此网络需要运行一段时间,即使用T个时刻后的平均发放率作为分类依据。
B. 我们希望的理想结果是除了正确的神经元以最高频率发放,其他神经元保持静默。常常采用交叉熵损失或者MSE损失,这里我们使用实际效果更好的MSE损失。
C. 每次网络仿真结束后,需要重置网络状态
观察结果
a. 训练测试正确率
取tau=2.0,T=100,batch_size=128,lr=1e-3,训练100个Epoch后,将会输出四个npy文件。测试集上的最高正确率为92.5%。取train_accs.npy和test_accs.npy通过matplotlib可视化训练和测试时的正确率曲线
    test_accs = np.load("./train_accs.npy")
    x = []
    y = []
    maxy = -1
    maxx = -1
    for t in range(len(test_accs)):
        if test_accs[t] > maxy:
            maxy = test_accs[t]
            maxx = t
        x.append(t)
        y.append(test_accs[t])
    plt.plot(x, y)
    plt.xlabel('Iteration')
    plt.ylabel('Acc')
    plt.title('Train Acc')
    plt.annotate(r'(%d,%f)' % (maxx, maxy), xy=(maxx, maxy), xycoords='data', xytext=(+10,+20), fontsize=16, arrowprops=dict(arrowstyle='->'), textcoords='offset points')
    plt.show()
    test_accs = np.load("./test_accs.npy")
    x = []
    y = []
    maxy = -1
    maxx = -1
    for t in range(len(test_accs)):
        if test_accs[t] > maxy:
            maxy = test_accs[t]
            maxx = t
        x.append(t)
        y.append(test_accs[t])
    plt.plot(x, y)
    plt.xlabel('Epoch')
    plt.ylabel('Acc')
    plt.title('Test Acc')
    plt.annotate(r'(%d,%f)' % (maxx, maxy), xy=(maxx, maxy), xycoords='data', xytext=(+10,+20), fontsize=16, arrowprops=dict(arrowstyle='->'), textcoords='offset points')
    plt.show()
b. 测试图片与发放脉冲
可视化测试集第一张图片
    # 初始化数据加载器
    train_dataset = torchvision.datasets.MNIST(
        root=dataset_dir,
        train=True,
        transform=torchvision.transforms.ToTensor(),
        download=False
    )
    test_dataset = torchvision.datasets.MNIST(root=dataset_dir,train=False,transform=torchvision.transforms.ToTensor(), download=False)

    train_data_loader = torch.utils.data.DataLoader(
        dataset=train_dataset,
        batch_size=batch_size,
        shuffle=True,
        drop_last=True)
    test_data_loader = torch.utils.data.DataLoader(
        dataset=test_dataset,
        batch_size=batch_size,
        shuffle=False,
        drop_last=False)

    with torch.no_grad():
        img, label = test_dataset[0]
        img = img.reshape(28, 28)
        plt.subplot(221)
        plt.imshow(img)
        plt.subplot(222)
        plt.imshow(img, cmap='gray')
        plt.subplot(223)
        plt.imshow(img, cmap=plt.cm.gray)
        plt.subplot(224)
        plt.imshow(img, cmap=plt.cm.gray_r)
        plt.show()
Firing rate: [[0. 0. 0. 0. 0. 0. 0. 1. 0. 0.]]
c. 训练好的模型脉冲发放和电压
通过visualizing模块中的函数可视化得到输出层的电压以及脉冲(输入为测试集第一张图片)
    test_spike = np.load("./s_t_array.npy")
    test_mem = np.load('./v_t_array.npy')

    visualizing.plot_2d_heatmap(array=np.asarray(test_mem), title='Membrane Potentials', xlabel='Simulating Step',
                                ylabel='Neuron Index', int_x_ticks=True, x_max=100, dpi=200)
    visualizing.plot_1d_spikes(spikes=np.asarray(test_spike), title='Membrane Potentials', xlabel='Simulating Step',
                               ylabel='Neuron Index', dpi=200)
    plt.show()
时间驱动:使用卷积SNN识别Fashion-MNIST
在本节教程中,我们将搭建一个卷积脉冲神经网络,对Fashion-MNIST数据集进行分类。Fashion-MNIST数据集,与MNIST数据集的格式相同,均为1 * 28 * 28的灰度图片。
卷积网络搭建
搭建卷积+全连接层的形式的SNN网络结构
class PythonNet(nn.Module):
    def __init__(self, T):
        super().__init__()
        self.T = T

        self.conv = nn.Sequential(
        nn.Conv2d(1, 128, kernel_size=3, padding=1, bias=False),
        nn.BatchNorm2d(128),
        neuron.IFNode(surrogate_function=surrogate.ATan()),
        nn.MaxPool2d(2, 2),  # 14 * 14

        nn.Conv2d(128, 128, kernel_size=3, padding=1, bias=False),
        nn.BatchNorm2d(128),
        neuron.IFNode(surrogate_function=surrogate.ATan()),
        nn.MaxPool2d(2, 2)  # 7 * 7
    )
1 * 28 * 28的输入经过这样的卷积层作用后,得到128 * 7 * 7的输出脉冲。
这样的卷积层,其实可以起到编码器的作用:在单双层MNIST识别的代码中,我们使用泊松编码器,将图片编码成脉冲。(28 * 28的实数值 -> 28 * 28的01脉冲)
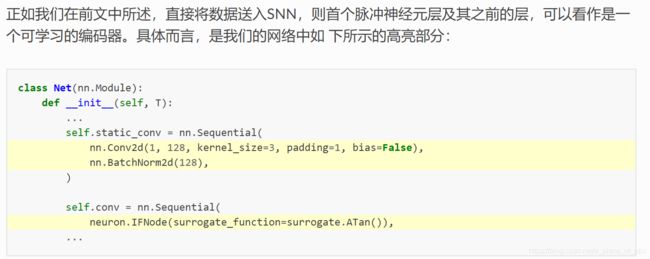
实际上我们完全可以直接将图片送入SNN,在这种情况下,SNN中的首层脉冲神经元层及其之前的层,可以看作是一个参数可学习的自编码器
nn.Conv2d(1, 128, kernel_size=3, padding=1, bias=False),
nn.BatchNorm2d(128),
neuron.IFNode(surrogate_function=surrogate.ATan())
即这3层网络,接收图片作为输入,输出脉冲,可以看作是编码器。
对于输入是不随时间变化的SNN,虽然SNN整体是有状态的,但网络的前几层可能没有状态,我们可以单独提取出这些层,将它们放到在时间上的循环之外, 避免额外计算。 调整后卷积层如下。
class PythonNet(nn.Module):
    def __init__(self, T):
        super().__init__()
        self.T = T

        self.static_conv = nn.Sequential(
            nn.Conv2d(1, 128, kernel_size=3, padding=1, bias=False),
            nn.BatchNorm2d(128),
        )

        self.conv = nn.Sequential(
            neuron.IFNode(surrogate_function=surrogate.ATan()), #这一层不知道为什么没有放到时间循环外,放到static_conv里应该也没问题
            nn.MaxPool2d(2, 2),  # 14 * 14

            nn.Conv2d(128, 128, kernel_size=3, padding=1, bias=False),
            nn.BatchNorm2d(128),
            neuron.IFNode(surrogate_function=surrogate.ATan()),
            nn.MaxPool2d(2, 2)  # 7 * 7

        )
训练SNN卷积网络
完整的训练代码在spikingjelly.clock_driven.examples.conv_fashion_mnist中,训练超参数如下:
Classify Fashion-MNIST

optional arguments:
  -h, --help            show this help message and exit
  -T T                  simulating time-steps
  -device DEVICE        device
  -b B                  batch size
  -epochs N             number of total epochs to run
  -j N                  number of data loading workers (default: 4)
  -data_dir DATA_DIR    root dir of Fashion-MNIST dataset
  -out_dir OUT_DIR      root dir for saving logs and checkpoint
  -resume RESUME        resume from the checkpoint path
  -amp                  automatic mixed precision training
  -cupy                 use cupy neuron and multi-step forward mode
  -opt OPT              use which optimizer. SDG or Adam
  -lr LR                learning rate
  -momentum MOMENTUM    momentum for SGD
  -lr_scheduler LR_SCHEDULER
                        use which schedule. StepLR or CosALR
  -step_size STEP_SIZE  step_size for StepLR
  -gamma GAMMA          gamma for StepLR
  -T_max T_MAX          T_max for CosineAnnealingLR
用如下的参数进行64个epoch训练:
Namespace(T=4, T_max=64, amp=True, b=128, cupy=False, data_dir='./', device='cuda:0', epochs=64, gamma=0.1, j=4, lr=0.1, lr_scheduler='CosALR', momentum=0.9, opt='SGD', out_dir='./logs', resume=None, step_size=32)
tensorboard上显示的测试集上的正确率结果如下图

其在第42个epoch的时候达到了0.933的最高测试正确率,对于SNN而言是非常不错的性能,仅仅略低于Fashion-MNIST的BenchMark中使用Normalization, random horizontal flip, random vertical flip, random translation, random rotation的ResNet18的94.9%正确率。
可视化编码器
截取教程原话:

现在我们来看一下,训练好的编码器,编码效果如何。让我们新建一个python文件,导入相关的模块,并重新定义一个batch_size=1的数据加载器,因为我们想要一张图片一张图片的查看:
    test_data_loader = torch.utils.data.DataLoader(
        dataset=torchvision.datasets.FashionMNIST(
            root='./',
            train=False,
            transform=torchvision.transforms.ToTensor(),
            download=True),
        batch_size=1,
        shuffle=True,
        drop_last=False)

    parser = argparse.ArgumentParser(description='Classify Fashion-MNIST')
    parser.add_argument('-T', default=8, type=int, help='simulating time-steps')
    parser.add_argument('-device', default='cuda:0', help='device')
    parser.add_argument('-b', default=128, type=int, help='batch size')
    parser.add_argument('-epochs', default=64, type=int, metavar='N',
                        help='number of total epochs to run')
    parser.add_argument('-j', default=4, type=int, metavar='N',
                        help='number of data loading workers (default: 4)')
    parser.add_argument('-data_dir', type=str, default= './', help='root dir of Fashion-MNIST dataset')
    parser.add_argument('-out_dir', type=str, default='./logs', help='root dir for saving logs and checkpoint')

    parser.add_argument('-resume', type=str, help='resume from the checkpoint path')
    parser.add_argument('-amp', action='store_true', help='automatic mixed precision training')
    parser.add_argument('-cupy', action='store_true', help='use cupy neuron and multi-step forward mode')

    parser.add_argument('-opt', type=str, default='SGD', help='use which optimizer. SDG or Adam')
    parser.add_argument('-lr', default=0.1, type=float, help='learning rate')
    parser.add_argument('-momentum', default=0.9, type=float, help='momentum for SGD')
    parser.add_argument('-lr_scheduler', default='CosALR', type=str, help='use which schedule. StepLR or CosALR')
    parser.add_argument('-step_size', default=32, type=float, help='step_size for StepLR')
    parser.add_argument('-gamma', default=0.1, type=float, help='gamma for StepLR')
    parser.add_argument('-T_max', default=64, type=int, help='T_max for CosineAnnealingLR')
    # python w1.py -opt SGD -data_dir /userhome/datasets/FashionMNIST/ -amp
    # python w1.py -opt SGD -data_dir /userhome/datasets/FashionMNIST/ -amp -cupy
    args = parser.parse_args()
    print(args)

    if args.cupy:
        net = CupyNet(T=args.T)
    else:
        net = PythonNet(T=args.T)
    print(net)
加载训练好的网络,提取编码器encoder:
	net.load_state_dict(torch.load('/data/data_hx/spikingjelly/spikingjelly/clock_driven/examples/logs/T_4_b_128_SGD_lr_0.1_CosALR_64_amp/checkpoint_max.pth', 'cpu')['net'])
    encoder = nn.Sequential(
        net.static_conv,
        net.conv[0]
    )
    encoder.eval()
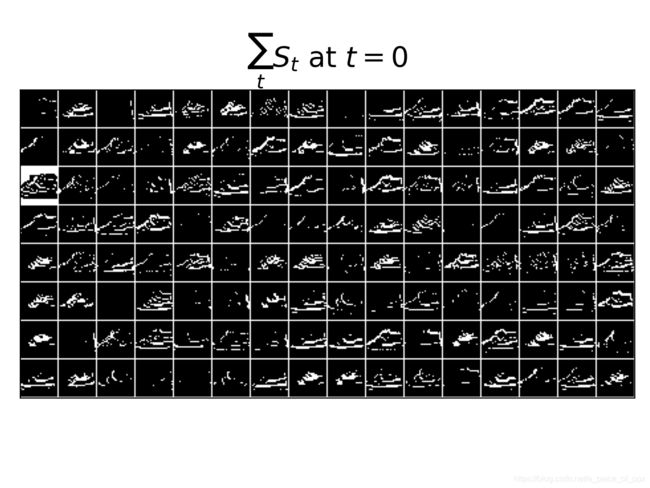
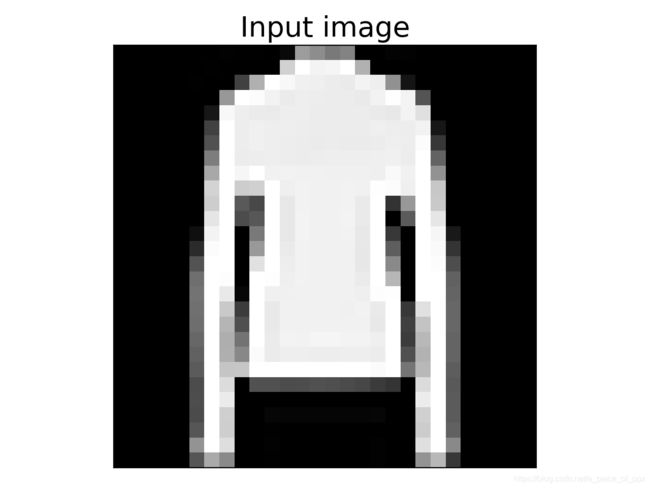
接下来,从数据集中抽取一张图片,送入编码器,并查看输出脉冲的累加值 ∑ \sum ∑t S t S_{t} St
为了显示清晰,我们还对输出的feature_map的像素值做了归一化,将数值范围线性变换到[0, 1]。
with torch.no_grad():
    # 每遍历一次全部数据集,就在测试集上测试一次
    for img, label in test_data_loader:
        fig = plt.figure(dpi=200)
        plt.imshow(img.squeeze().numpy(), cmap='gray')
        # 注意输入到网络的图片尺寸是 ``[1, 1, 28, 28]``,第0个维度是 ``batch``,第1个维度是 ``channel``
        # 因此在调用 ``imshow`` 时,先使用 ``squeeze()`` 将尺寸变成 ``[28, 28]``
        plt.title('Input image', fontsize=20)
        plt.xticks([])
        plt.yticks([])
        plt.show()
        out_spikes = 0
        for t in range(net.T):
            out_spikes += encoder(img).squeeze()
            # encoder(img)的尺寸是 ``[1, 128, 28, 28]``,同样使用 ``squeeze()`` 变换尺寸为 ``[128, 28, 28]``
            if t == 0 or t == net.T - 1:
                out_spikes_c = out_spikes.clone()
                for i in range(out_spikes_c.shape[0]):
                    if out_spikes_c[i].max().item() > out_spikes_c[i].min().item():
                        # 对每个feature map做归一化,使显示更清晰
                        out_spikes_c[i] = (out_spikes_c[i] - out_spikes_c[i].min()) / (out_spikes_c[i].max() - out_spikes_c[i].min())
                visualizing.plot_2d_spiking_feature_map(out_spikes_c, 8, 16, 1, None)
                plt.title('$\\sum_{t} S_{t}$ at $t = ' + str(t) + '$', fontsize=20)
                plt.show()
其中的visualizing.plot_2d_spiking_feature_map将C个尺寸为W * H的脉冲矩阵,全部画出,然后排列成nrows行ncols列。实现如下:
def plot_2d_spiking_feature_map(spikes: np.asarray, nrows, ncols, space, title: str, dpi=200):
    '''
    :param spikes: shape=[C, W, H],C个尺寸为W * H的脉冲矩阵,矩阵中的元素为0或1。这样的矩阵一般来源于卷积层后的脉冲神经元的输出
    :param nrows: 画成多少行
    :param ncols: 画成多少列
    :param space: 矩阵之间的间隙
    :param title: 图的标题
    :param dpi: 绘图的dpi
    :return: 一个figure,将C个矩阵全部画出,然后排列成nrows行ncols列

    将C个尺寸为W * H的脉冲矩阵,全部画出,然后排列成nrows行ncols列。这样的矩阵一般来源于卷积层后的脉冲神经元的输出,通过这个函数\\
    可以对输出进行可视化。示例代码:

    .. code-block:: python

        from spikingjelly import visualizing
        import numpy as np
        from matplotlib import pyplot as plt

        C = 48
        W = 8
        H = 8
        spikes = (np.random.rand(C, W, H) > 0.8).astype(float)
        visualizing.plot_2d_spiking_feature_map(spikes=spikes, nrows=6, ncols=8, space=2, title='Spiking Feature Maps', dpi=200)
        plt.show()

    .. image:: ./_static/API/visualizing/plot_2d_spiking_feature_map.*
        :width: 100%

    '''
    if spikes.ndim != 3:
        raise ValueError(f"Expected 3D array, got {spikes.ndim}D array instead")

    C = spikes.shape[0]

    assert nrows * ncols == C, 'nrows * ncols != C'

    h = spikes.shape[1]
    w = spikes.shape[2]
    y = np.ones(shape=[(h + space) * nrows, (w + space) * ncols]) * spikes.max().item()
    index = 0
    for i in range(space // 2, y.shape[0], h + space):
        for j in range(space // 2, y.shape[1], w + space):
            y[i:i + h, j:j + w] = spikes[index]
            index += 1
    fig, maps = plt.subplots(dpi=dpi)
    maps.set_title(title)
    maps.imshow(y, cmap='gray')

    maps.get_xaxis().set_visible(False)
    maps.get_yaxis().set_visible(False)
    return fig, maps


观察可以发现,编码器的累计输出脉冲 ∑ \sum ∑t S t S_{t} St非常接近原图像的轮廓,表明这种自学习的脉冲编码器,有很强的编码能力。
思考
单纯从分类准确率来看,SNN已经达到了不错的性能。但是教程中的SNN是ANN的框架,比如卷积、池化、BN这些仍然是ANN的操作,这里SNN的实现只是将发放实值的神经元换为发放脉冲的LIF神经元,网络结构和BP训练方式没有SNN化。直接将图片送入网络,也不好解释SNN的生物合理性。
还有一点是对SNN结构要求不高的情况下,这种基于最大神经元发放频率的SNN在分类上应用尚可,但是对于one stage这类检测问题,转换为回归后,准确的实数值不能用分类相对关系的最大来替代。如何获得更纯的SNN,SNN如何应用到更复杂的回归问题,仍然是需要考虑的问题。
参考
原文教程:事件驱动
zalandoresearch/fashion-mnist


