Python数据可视化之条形图和热力图
Python数据可视化之条形图和热力图
提示:介绍
简单介绍Pthon可视化的图表使用
提示:热力图和条形图
文章目录
- Python数据可视化之条形图和热力图
- 前言
- 一、导入数据包
- 二、选择数据集
-
- 2.加载数据
- 2.读入数据
- 总结
前言
提示:这里可以添加本文要记录的大概内容:
与往常一样,我们首先设置编码环境。
提示:以下是本篇文章正文内容,下面案例可供参考
一、导入数据包
import pandas as pd
pd.plotting.register_matplotlib_converters()
import matplotlib.pyplot as plt
%matplotlib inline
import seaborn as sns
print("Setup Complete")
设置完成
二、选择数据集
在本教程中,我们将使用美国交通部跟踪航班延误的数据集。
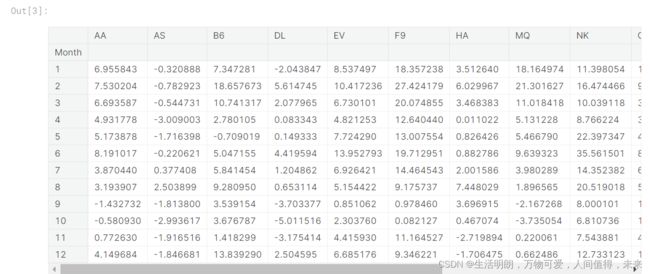
在 Excel 中打开此 CSV 文件会显示每个月的行(其中 1 = 一月,2 = 二月等)和每个航空公司代码的一列。

每个条目显示不同航空公司和月份(均为 2015 年)的平均到达延迟(以分钟为单位)。 负条目表示(平均)倾向于提前到达的航班。 例如,美国航空公司 1 月份的平均航班(航空公司代码:AA)大约晚点 7 分钟,而阿拉斯加航空公司 4 月份的平均航班(航空公司代码:AS)大约提前 3 分钟到达。
2.加载数据
和以前一样,我们使用 pd.read_csv 命令加载数据集。
# Path of the file to read
flight_filepath = "../input/flight_delays.csv"

# Read the file into a variable flight_data
flight_data = pd.read_csv(flight_filepath, index_col="Month")
您可能会注意到代码比我们在上一个教程中使用的代码略短。 在这种情况下,由于行标签(来自“月份”列)与日期不对应,所以我们不在括号中添加 parse_dates=True。 但是,我们像以前一样保留前两段文本,以提供两者:
数据集的文件路径(在本例中为 flight_filepath),以及
将用于索引行的列的名称(在本例中,index_col=“Month”)。
2.读入数据
代码如下(示例):
data = pd.read_csv(
    'https://labfile.oss.aliyuncs.com/courses/1283/adult.data.csv')
print(data.head())
检查数据
由于数据集很小,我们可以很容易地打印出它的所有内容。 这是通过编写仅包含数据集名称的一行代码来完成的
# Print the data
flight_data

条形图
假设我们要创建一个条形图,按月显示 Spirit Airlines(航空公司代码:NK)航班的平均到达延误时间。
# Set the width and height of the figure
plt.figure(figsize=(10,6))

# Add title
plt.title("Average Arrival Delay for Spirit Airlines Flights, by Month")

# Bar chart showing average arrival delay for Spirit Airlines flights by month
sns.barplot(x=flight_data.index, y=flight_data['NK'])

# Add label for vertical axis
plt.ylabel("Arrival delay (in minutes)")
用于自定义文本(标题和垂直轴标签)和图形大小的命令与之前的教程相似。 创建条形图的代码是新的:
# Bar chart showing average arrival delay for Spirit Airlines flights by month
sns.barplot(x=flight_data.index, y=flight_data['NK'])
它包含三个主要组件:
sns.barplot - 这告诉笔记本我们要创建一个条形图。
请记住,sns 指的是 seaborn 包,您在本课程中用于创建图表的所有命令都将以此前缀开头。
x=flight_data.index - 这决定了在水平轴上使用什么。 在这种情况下,我们选择了索引行的列(在这种情况下,包含月份的列)。
y=flight_data[‘NK’] - 这会设置数据中用于确定每个条形高度的列。 在这种情况下,我们选择“NK”列。
重要说明:您必须使用 flight_data.index 选择索引列,并且不能使用 flight_data[‘Month’](这将返回错误)。 这是因为当我们加载数据集时,“月份”列用于索引行。 我们总是必须使用这种特殊的符号来选择索引列。
热图
我们还有另一种绘图类型需要了解:热图!
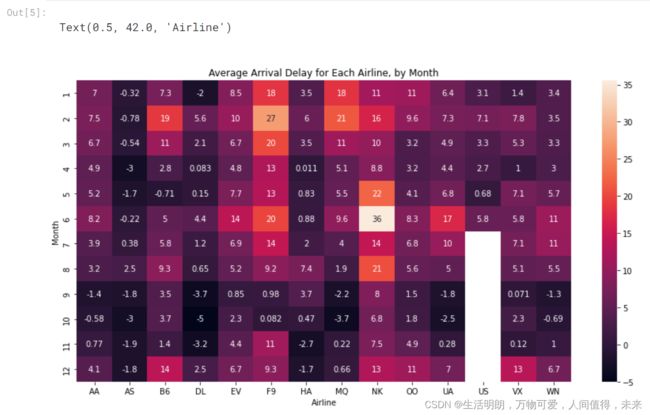
在下面的代码单元中,我们创建了一个热图来快速可视化 flight_data 中的模式。 每个单元格都根据其对应的值进行颜色编码。
# Set the width and height of the figure
plt.figure(figsize=(14,7))

# Add title
plt.title("Average Arrival Delay for Each Airline, by Month")

# Heatmap showing average arrival delay for each airline by month
sns.heatmap(data=flight_data, annot=True)

# Add label for horizontal axis
plt.xlabel("Airline")
#创建热图的相关代码如下
# Heatmap showing average arrival delay for each airline by month
sns.heatmap(data=flight_data, annot=True)
此代码包含三个主要组件:
sns.heatmap - 这告诉笔记本我们想要创建一个热图。
data=flight_data - 这告诉笔记本使用 flight_data 中的所有条目来创建热图。
annot=True - 这确保每个单元格的值都出现在图表上。 (忽略它会删除每个单元格中的数字!)
您可以在表中检测到哪些模式? 例如,如果你仔细观察,年底前的月份(尤其是 9-11 月份)对所有航空公司来说都显得相对黑暗。 这表明航空公司在这几个月里(平均而言)更善于保持航班时刻表!
总结
提示:总结:
以上就是今天要讲的内容,本文仅仅简单介绍了条形图个热力图的使用

