【matplotlib】20.其他图
#【matplotlib】20.其他图
2023.1.20
polt为点线图,后面我们看看plt里面的其他图
20.1 Scatter 散点图
plt.scatter()
import matplotlib.pyplot as plt
import numpy as np

n =1024

x = np.random.normal(0,1,n)
y = np.random.normal(0,1,n)

# 颜色 这个应该是个tan值?范围是R
T = np.arctan2(y,x)

#Scatter
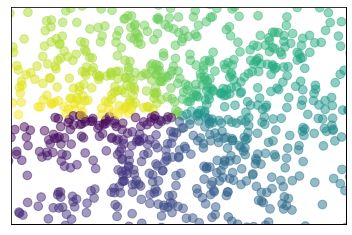
plt.scatter(x,y, s=75, c=T, alpha=0.5)

# 设置幕布,上一节有讲

plt.xlim(-1.5,1.5)
plt.xticks(()) # 没有刻度

plt.ylim(-1.5,1.5)
plt.yticks(())

plt.show()
- 我认为某个区域 坐标是类似的 所以tan就是类似的 所以颜色是类似的,才会有这种过度颜色 并且颜色一块块的
c是color
20.2 Bar柱状图
- plt.bar()
import matplotlib.pyplot as plt
import numpy as np

n = 12

# 数据准备
X = np.arange(n)
Y1 = np.random.uniform(0.5, 1.0, n)
Y2 = np.random.uniform(0.5, 1.0, n)

# 柱状图
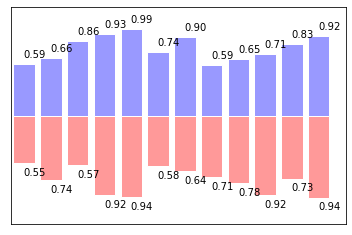
plt.bar(X, +Y1, facecolor='#9999ff', edgecolor='white')
plt.bar(X, -Y2, facecolor='#ff9999', edgecolor='white')


# 柱状图上的文字
for x, y in zip(X, Y1):
    # ha: horizontal alignment
    # va: vertical alignment
    plt.text(x + 0.4, y + 0.05, '%.2f' % y, ha='center', va='bottom')


for x, y in zip(X, Y2):
    # ha: horizontal alignment
    # va: vertical alignment
    plt.text(x + 0.4, -y - 0.05, '%.2f' % y, ha='center', va='top')

# 窗口设置
plt.xlim(-.5, n)
plt.xticks(())
plt.ylim(-1.25, 1.25)
plt.yticks(())

plt.show()
-
np.random.uniform(0.5, 1.0, n):均匀分布:https://blog.csdn.net/lemonxiaoxiao/article/details/109244755 -
- 数值上下限就是0.5-1;一共n个柱
-
edgecolor:图形边界 -
plt.text():图表上的数字,
20.3 Contours 等高线图
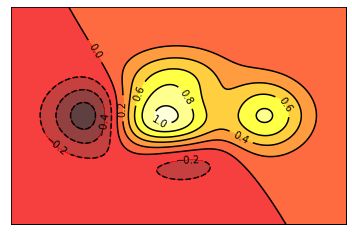
plt.contourf():画等高图plt.contour():画等高线plt.clabel添加高度数字
- 数据准备
高: f ( x , y ) = ( 1 − x / 2 + x 5 + y 3 ) ∗ e ( − x 2 − y 2 ) f(x,y) = (1 - x / 2 + x^5 + y^3) * e^{(-x^2 -y^2)} f(x,y)=(1−x/2+x5+y3)∗e(−x2−y2)
import matplotlib.pyplot as plt
import numpy as np

def f(x,y):
    # the height function
    return (1 - x / 2 + x**5 + y**3) * np.exp(-x**2 -y**2)

# 数据准备
n = 256
x = np.linspace(-3, 3, n)
y = np.linspace(-3, 3, n)
X,Y = np.meshgrid(x, y)
这是个3D图,x,y和高度
高度值使用一个height function f(x,y)生成x,y分布生成n=256个,用meshgrid在二维平面中将每一个x和每一个y分别对应起来,编织成栅格:
x,y和高度准备就绪
- 根据高度画图
plt.contourf()
# 根据高度画图
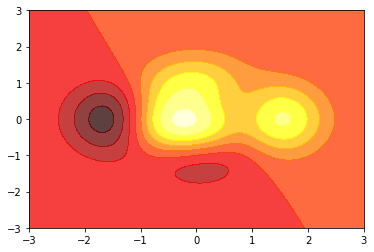
plt.contourf(X, Y, f(X, Y), 8, alpha=.75, cmap=plt.cm.hot)
- 分成了八个颜色
- f(X,Y) 的值对应到color map的暖色组中寻找对应颜色
- 绘制等高线
plt.contour函数划线
plt.contourf(X, Y, f(X, Y), 8, alpha=.75, cmap=plt.cm.hot)


# 绘制等高线
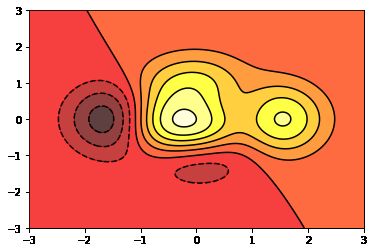
C = plt.contour(X, Y, f(X, Y), 8, colors='black', linewidth=.5)
C:\Users\YANG\AppData\Local\Temp\ipykernel_10368\4128262880.py:3: UserWarning: The following kwargs were not used by contour: 'linewidth'
  C = plt.contour(X, Y, f(X, Y), 8, colors='black', linewidth=.5)
- 添加高度数字
plt.clabel添加高度数字
plt.contourf(X, Y, f(X, Y), 8, alpha=.75, cmap=plt.cm.hot)


# 绘制等高线
C = plt.contour(X, Y, f(X, Y), 8, colors='black', linewidth=.5)

plt.clabel(C, inline=True, fontsize=10)
plt.xticks(())
plt.yticks(())
C:\Users\YANG\AppData\Local\Temp\ipykernel_10368\4170655076.py:5: UserWarning: The following kwargs were not used by contour: 'linewidth'
  C = plt.contour(X, Y, f(X, Y), 8, colors='black', linewidth=.5)


([], [])
inline控制是否将Label画在线里面
20.4 Image图片
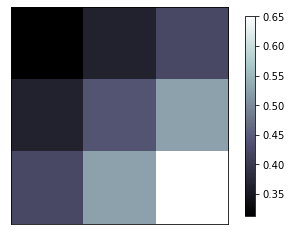
Image图片 纯数字矩阵图
import matplotlib.pyplot as plt
import numpy as np

# 数据准备
a = np.array([0.313660827978, 0.365348418405, 0.423733120134,
              0.365348418405, 0.439599930621, 0.525083754405,
              0.423733120134, 0.525083754405, 0.651536351379]).reshape(3,3)

# 主图图像
plt.imshow(a, interpolation='nearest', cmap='bone')

#侧面色彩卡
plt.colorbar(shrink=.92)

plt.xticks(())
plt.yticks(())
plt.show()
-
三行三列的格子,a代表每一个值,图像右边有一个注释,白色代表值最大的地方,颜色越深值越小。
-
cmap=plt.cmap.bone:cmap的参数,具有较高的黑-白成分的灰度色图,用于对灰度图添加电子的视图 -
origin='lower':代表的就是选择的原点的位置。 -
添加一个
shrink参数,使colorbar的长度变短为原来的92%:
参考:https://blog.csdn.net/a892573486/article/details/107542839
20.5 3D数据
- 进行 3D Plot 时除了导入 matplotlib ,还要额外添加一个模块,即
Axes3D3D 坐标轴显示
import numpy as np
import matplotlib.pyplot as plt
from mpl_toolkits.mplot3d import Axes3D
- 打开一个窗口 看看形状
fig = plt.figure()
ax = Axes3D(fig)
C:\Users\YANG\AppData\Local\Temp\ipykernel_12732\2957860354.py:2: MatplotlibDeprecationWarning: Axes3D(fig) adding itself to the figure is deprecated since 3.4. Pass the keyword argument auto_add_to_figure=False and use fig.add_axes(ax) to suppress this warning. The default value of auto_add_to_figure will change to False in mpl3.5 and True values will no longer work in 3.6.  This is consistent with other Axes classes.
  ax = Axes3D(fig)
- 往3D图像里面添加数据
fig = plt.figure(figsize=(8,8))
ax = Axes3D(fig)
# X, Y value
X = np.arange(-4, 4, 0.25)
Y = np.arange(-4, 4, 0.25)
X, Y = np.meshgrid(X, Y)    # x-y 平面的网格,前面有介绍,也就是x,y对应起来

# 准备Z
R = np.sqrt(X ** 2 + Y ** 2)
# height value
Z = np.sin(R)

# 图像控制
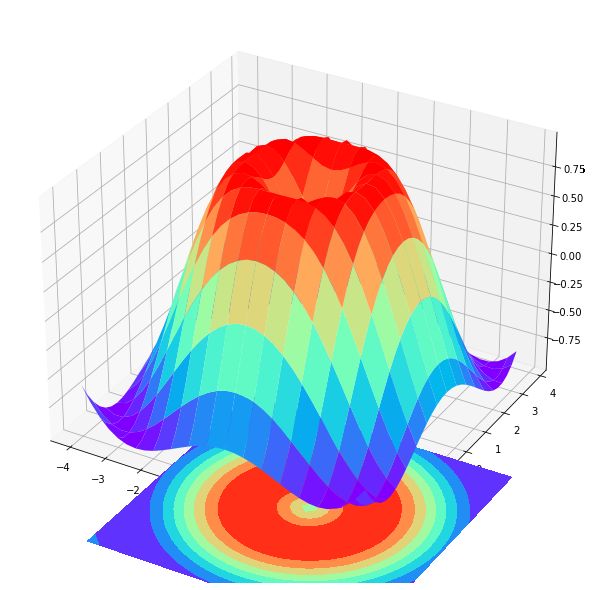
ax.plot_surface(X, Y, Z, rstride=2, cstride=2, cmap=plt.get_cmap('rainbow'))

# 投影控制
ax.contourf(X, Y, Z, zdir='z', offset=-2, cmap=plt.get_cmap('rainbow'))
C:\Users\YANG\AppData\Local\Temp\ipykernel_12732\1111420424.py:2: MatplotlibDeprecationWarning: Axes3D(fig) adding itself to the figure is deprecated since 3.4. Pass the keyword argument auto_add_to_figure=False and use fig.add_axes(ax) to suppress this warning. The default value of auto_add_to_figure will change to False in mpl3.5 and True values will no longer work in 3.6.  This is consistent with other Axes classes.
  ax = Axes3D(fig)
-
rstride 和 cstride 分别代表 row 和 column 的跨度,数值越大,那个一片颜色的面积越大
-
ax.plot_surface:图像控制 -
ax.contourf:投影控制 -
zdir='z':控制往哪里投,这事在XY平面上投
-
offset=-2:控制投影平面在投影面的高度,这里放到z=-2平面上了
