Echarts+Vue3.0 大数据可视化项目构建
项目结构
myapp文件夹:前端
项目初始化
进入app.vue,清空所有外在样式
项目分辨率响应——lib-flexible
项目页面布局随窗口大小改变而改变
使用第三方库lib-flexible,rem屏幕适配
myapp> npm install --save lib-flexible
然后在main.js里面引用插件
import 'lib-flexible/flexible'
由于它默认的分辨率是在指定的范围内生效的,所以我们需要根据当前的项目进行分辨率的调整
进入以下文件,修改默认的配置文件
![]()
以下是默认配置
function refreshRem(){
        var width = docEl.getBoundingClientRect().width;
        if (width / dpr > 540) {
            width = 540 * dpr;
        }
        var rem = width / 10;
        docEl.style.fontSize = rem + 'px';
        flexible.rem = win.rem = rem;
    }
以下是修改好的配置
function refreshRem(){
        var width = docEl.getBoundingClientRect().width;
        // if (width / dpr > 540) {
        //     width = 540 * dpr;
        // }
        // var rem = width / 10;

        // 修改 最小值400 最大值2560
        if (width / dpr < 400) {
            width = 400 * dpr;
        } else if (width / dpr > 2560) {
            width = 2560 * dpr;
        }
        // 设置成24份,美工给设计稿1920px,除以24刚好就是80px
        // 1rem 就是 80px
        var rem = width / 24;
        docEl.style.fontSize = rem + 'px';
        flexible.rem = win.rem = rem;
    }
修改完配置文件,记得项目需要重启
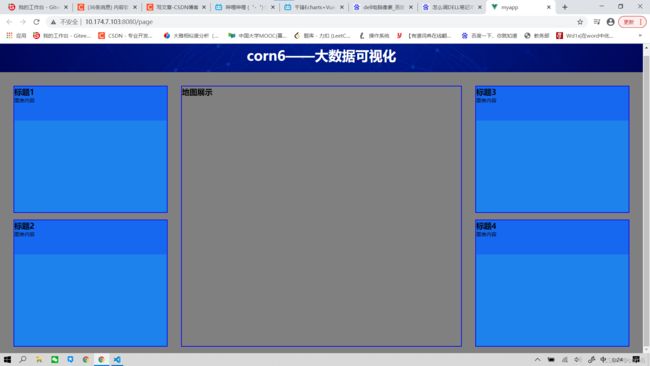
效果如下,注意font-size随着窗口大小的改变而改变

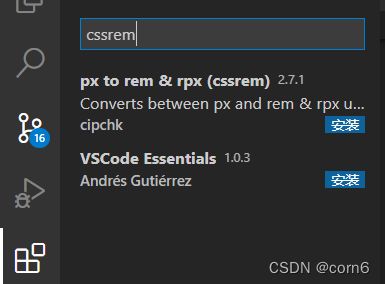
项目分辨率响应——px与rem转化插件
顶部信息条创建
在app.vue里面设置body背景图
body {
  background: url('~@/assets/bg.jpg') top center no-repeat;
  background-size: 100%;
}
创建顶部信息条,进入homePage.vue
<template>
  <div>
    <header>
      <h1>
        corn6——大数据可视化
      h1>
    header>
  div>
template>
header {
  height: 1.25rem;
  width: 100%;
  background-color: rgba(0, 0, 255, .2);
  /* 标题文字的样式 */
  h1 {
    font-size: .5rem;
    color: #fff;
    text-align: center;
    line-height: 1.25rem;
  }
}
页面主体创建
划分左中右三个容器
    <section class="container">

      <section class="leftItem">
      section>

      <section class="middleItem">
      section>

      <section class="rightItem">
      section>
    section>
/* 大容器的样式 */
.container {
  /* 固定值,不需要改变,不设置rem单位 */
  min-width: 1080px;
  max-width: 1900px;
  margin: 0 auto;
  padding: .625rem .625rem 0;
  background: gray;
  display: flex;
  /* 设置左右在页面的份数 */
  .leftItem, .rightItem {
    flex: 3;
  }
  .middleItem {
    flex: 5;
  }
}
由于重复出现4个正方形区域,因此可以把这个区域剥离成为一个组件,然后在其中放置slot插槽,重复调用该组件
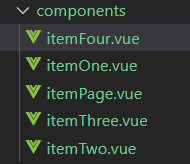
在components里面新建一个itemPage.vue
!
<template>
  <div class="item">

    <slot>slot>
  div>
template>

<script>
export default {
  data () {
    return {
        name: 'itemPage'
    };
  },

  components: {},

  computed() {},

  mounted() {},

  methods: {}
}

script>
<style lang='less' scoped>
.item {
    height: 12.5rem;
    border: .0313rem solid blue;
    margin: .3125rem;
    background-color: rgba(12, 130, 255, .85);
}
style>
然后在homepage里面引用
    <section class="container">

      <section class="leftItem">
        <ItemPage/>
        <ItemPage/>
      section>

      <section class="middleItem">
      section>

      <section class="rightItem">
        <ItemPage/>
        <ItemPage/>
      section>
    section>
!
<template>
  <header>
    <h2>
        标题
    h2>
    <div>
        图表内容
    div>
  header>
template>

<script>
export default {
  data () {
    return {
    };
  },

  components: {},

  computed() {},

  mounted() {},

  methods: {}
}

script>
<style lang='scss' scoped>
style>
然后将四个组件嵌入插槽
    <section class="container">

      <section class="leftItem">
        <ItemPage>
          <ItemOne/>
        ItemPage>
        <ItemPage>
          <ItemTwo/>
        ItemPage>
      section>

      <section class="middleItem">
      section>

      <section class="rightItem">
        <ItemPage>
          <ItemThree/>
        ItemPage>
        <ItemPage>
          <ItemFour/>
        ItemPage>
      section>
    section>
  div>
template>

<script>
import ItemPage from "@/components/itemPage.vue";

import ItemOne from "@/components/itemOne.vue";
import ItemTwo from "@/components/itemTwo.vue";
import ItemThree from "@/components/itemThree.vue";
import ItemFour from "@/components/itemFour.vue";

export default {
  data () {
    return {
        name: 'homePage'
    };
  },

  components: {
    ItemPage,
    ItemOne,
    ItemTwo,
    ItemThree,
    ItemFour
  },
然后单独对中间区域进行样式设置
.middleItem {
    flex: 5;
    height: 9.625rem;
    border: .0313rem solid blue;
    margin: .25rem;
  }
引用echarts(provide/inject)
npm install --save echarts
在App.vue中,从vue中解构出provide,并引入echarts
import { provide } from "vue";
import * as echarts from "echarts";
然后使用provide,向所有后代提供数据
即在app里面,把echarts传递到所有子组件当中
export default {
  setup() {
    // 第一个参数是随便起的名字,第二个参数是传递的内容
    provide("echarts", echarts)
  }
}
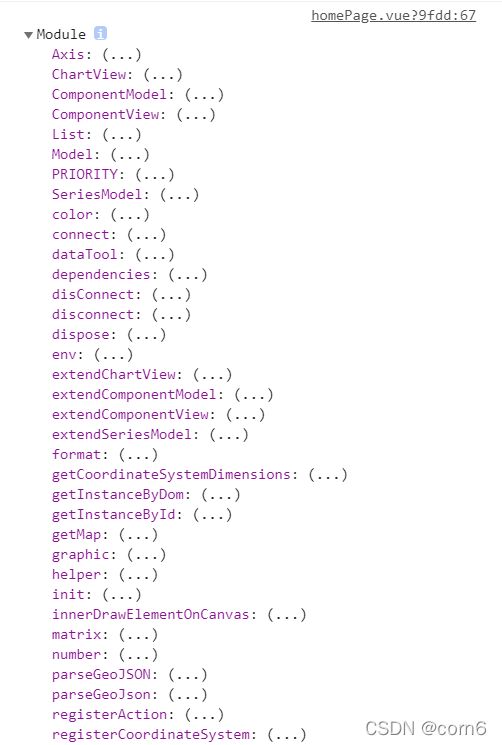
然后选择子组件homePage.vue,尝试使用
首先从vue中解构出inject,用于接收数据
import { inject } from "vue";

setup () {
    // 把接收的值传递给变量 $echarts
    let $echarts = inject("echarts");
    console.log($echarts);
  }
引用axios
npm install --save axios
全局注入的方式同上
<script>
import { provide } from "vue";
import axios from "axios";

export default {
  setup() {
    // 第一个参数是随便起的名字,第二个参数是传递的内容
    provide("axios", axios);
  }
}
</script>
let $http = inject("axios");
后台接口创建express
官网如下
https://www.expressjs.com.cn/
express——创建路由
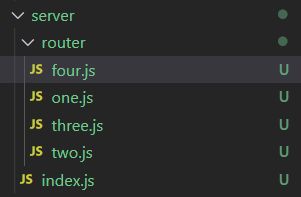
新建一个server文件夹放后台代码,新建一个index.js,新建一个router文件夹放路由
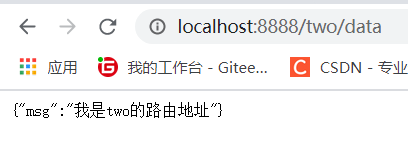
由于总共有4个相关的图表需要获取后台数据,因此在router文件夹下创建四个one.js放路由代码
在server文件夹下,引用express
server> npm install --save express
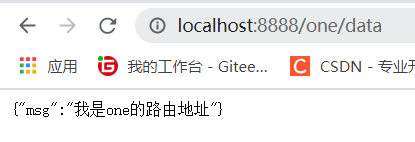
在one.js中引进express,并设置最基本的路由
let express = require("express");
// 实现路由功能
let router = express.Router();

// 第一个参数,路由地址
// 第二个参数,回调函数;req请求,res响应
router.get("/data", (req, res) => {
    // 向前台响应内容
    res.send({msg: "我是one的路由地址"})
})

module.exports = router;
two等同理;
接下来需要让以上四个文件关联,并使用一个http进行容纳;
进入index.js进行合并并创建http
let express = require("express");
// 使用app变量,方便使用express的相关属性及方法
let app = express();

// 引用路由文件
let chartOne = require("./router/one");
let chartTwo = require("./router/two");
let chartThree = require("./router/three");
let chartFour = require("./router/four");

// 使用中间件来配置路由
// 每次进入服务都会优先进入中间件,根据第一个参数设置的地址匹配对应的内容
// 匹配到“/one”,就使用chartOne
app.use("/one", chartOne);
app.use("/two", chartTwo);
app.use("/three", chartThree);
app.use("/four", chartFour);

// 监听端口
app.listen(8888);
运行方式:node 文件名
express——api接口数据创建
准备好json数据(one/two/three/four)
one.json如下:
{
    "chartData": [
        {"title": "冰箱", "num": 1827},
        {"title": "洗衣机", "num": 342},
        {"title": "电视机", "num": 541},
        {"title": "微波炉", "num": 1347},
        {"title": "烤箱", "num": 2431},
        {"title": "空调", "num": 876},
        {"title": "洗碗机", "num": 1578}
    ]
}
有了数据后,在server文件夹下新建一个mock文件夹
将以上四个json数据放进去
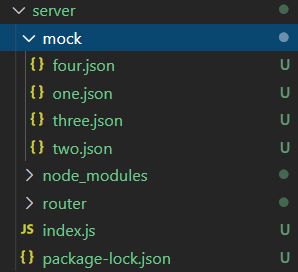
然后就可以在one.js里面使用one.json,然后直接通过send()将数据返回给前台
let oneData = require("../mock/one.json");

// 第一个参数,路由地址
// 第二个参数,回调函数;req请求,res响应
router.get("/data", (req, res) => {
    // 向前台响应内容
    res.send({msg: "我是one的路由地址", chartData: oneData});
})
销售总量图表基本设置
进入itemOne.vue,引用echarts
  setup() {
    let $echarts = inject("echarts");

    onMounted(() => {
      // init初始化echarts图表
      let myChart = $echarts.init(document.getElementById("oneChart"));

      myChart.setOption({
        xAixs: {
          type: "value"
        },
        yAxis: {
          type: "category"
        },
        series: [
          {
            type: "bar"
          }
        ]
      })
    });
  }
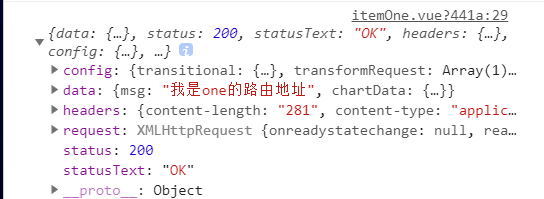
引入axios,接收data
setup() {
    let $echarts = inject("echarts");
    let $http = inject("axios");

    async function getState() {
      let oneData = await $http({url: "http://localhost:8888/one/data"});
      console.log(oneData);
    }

    onMounted(() => {
      getState();
    });
  }
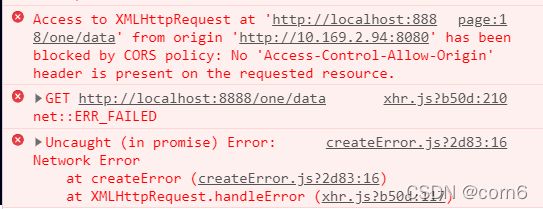
使用cors后端解决跨域问题
进入server文件的index.js
// 使用app变量,方便使用express的相关属性及方法
let app = express();
// 设置跨域
app.use(function(req, res, next) {
    res.header("Access-Control-Allow-Origin", "*");
    res.header("Access-Control-Allow-Headers", "Content-Type,Content-Length,Authority");
    res.header("Access-Control-Allow-Methods", "PUT,POST,GET,DELETE,OPTIONS");
    // 千万不要网
    next();
})
设置基准baseURL
直接进入APP.vue里面设置
// 设置基准路径
axios.defaults.baseURL = "http://localhost:8888";
然后发送get()请求时就不用写基准路径了
async function getState() {
      let oneData = await $http({url: "/one/data"});
      console.log(oneData);
    }
配置销售总量图表数据
!<!--  -->
<template>
  <header>
    <h2>
        标题1
    </h2>
    <div class="chart" id="oneChart">
        图表内容
    </div>
  </header>
</template>

<script>
import { inject, onMounted, reactive } from "vue";
export default {
  data () {
    return {
    };
  },

  components: {},

  setup() {
    let $echarts = inject("echarts");
    let $http = inject("axios");

    // 创建一个对象变量
    // 创建两个数组变量
    let data = reactive({});
    let xData = reactive([]);
    let yData = reactive([]);

    // 请求数据
    async function getState() {
      data = await $http({url: "/one/data"});
      console.log(data);
    }

    // 处理数据
    function setData() {
      xData = data.data.chartData.chartData.map(v=>v.title);
      yData = data.data.chartData.chartData.map(v=>v.num);
    }

    onMounted(() => {
      // init初始化echarts图表
      let myChart = $echarts.init(document.getElementById("oneChart"));

      getState().then(() => {
        setData();

        myChart.setOption({
        xAxis: {
          type: "value"
        },
        yAxis: {
          type: "category",
          data: xData
        },
        series: [
          {
            type: "bar",
            data: yData
          }
        ]
      })
      });
    });

    return {
      data,
      xData,
      yData,
      getState,
      setData
    }
  }
}

</script>
<style lang='less' scoped>
.chart {
  height: 5rem;

}
</style>
优化样式
!<!--  -->
<template>
  <header>
    <h2>
        标题1
    </h2>
    <div class="chart" id="oneChart">
        图表内容
    </div>
  </header>
</template>

<script>
import { inject, onMounted, reactive } from "vue";
export default {
  data () {
    return {
    };
  },

  components: {},

  setup() {
    let $echarts = inject("echarts");
    let $http = inject("axios");

    // 创建一个对象变量
    // 创建两个数组变量
    let data = reactive({});
    let xData = reactive([]);
    let yData = reactive([]);

    // 请求数据
    async function getState() {
      data = await $http({url: "/one/data"});
      console.log(data);
    }

    // 处理数据
    function setData() {
      xData = data.data.chartData.chartData.map(v=>v.title);
      yData = data.data.chartData.chartData.map(v=>v.num);
    }

    onMounted(() => {
      // init初始化echarts图表
      let myChart = $echarts.init(document.getElementById("oneChart"));

      getState().then(() => {
        setData();

        myChart.setOption({
        grid: {
          top: "3%",
          left: "1%",
          right: "6%",
          bottom: "3%",
          // 以上设置的位置,对坐标轴也起作用
          containLabel: true
        },
        xAxis: {
          type: "value",
          axisLine: {
            lineStyle: {
              color: "#fff"
            }
          }
        },
        yAxis: {
          type: "category",
          data: xData,
          axisLine: {
            lineStyle: {
              color: "#fff"
            }
          }
        },
        series: [
          {
            type: "bar",
            data: yData,
            itemStyle: {
              normal: {
                // 柱状图圆角
                barBorderRadius: [0, 20, 20, 0],
                // 配置渐变颜色
                color: new $echarts.graphic.LinearGradient(0, 0, 1, 0, [
                  {
                  offset: 0,
                  color: "#005eaa"
                  },
                  {
                    offset: 0.5,
                    color: "#339ca8"
                  },
                  {
                    offset: 1,
                    color: "#cda819"
                  }
                ])
              }
            }
          }
        ]
      })
      });
    });

    return {
      data,
      xData,
      yData,
      getState,
      setData
    }
  }
}

</script>
<style lang='less' scoped>
.chart {
  height: 4.375rem;
}
h2 {
  height: .3125rem;
  color: #fff;
  line-height: .3125rem;
  font-size: .25rem;
  text-align: center;
}
</style>
地图展示
public文件夹下新建一个map文件夹,放置中国地图数据
在components中新建mapPage.vue,
!<!--  -->
<template>
  <div class="map" id="map">
  </div>
</template>

<script>
// 单独引进,避免走基准路径
import axios from "axios";
import { onMounted, reactive, inject } from "vue";
export default {
  setup() {
      let mapData = reactive({});
      let $echarts = inject("echarts");

      async function getState() {
          mapData = await axios.get("http://localhost:8080/map/china.json");
      }

      onMounted(() => {
          getState().then(() => {
            console.log(mapData)
            // 设置地图
            // 第一个参数给地图起名字
            $echarts.registerMap("china", mapData.data)
            // init初始化echarts图表
            let myChart = $echarts.init(document.getElementById("map"));
            myChart.setOption({
                geo: {
                    map: "china",
                    itemStyle: {
                        areaColor: "#0099ff",
                        borderColor: "#00ffff",
                        // 添加阴影
                        shadowColor: "rgba(230, 130, 70, 0.5)",
                        shadowBlur: 30,
                        // 聚焦省份高亮效果
                        emphasis: {
                            focus: "self"
                        }
                    }
                },
                // 聚焦各省份,显示悬浮气泡
                tooltip: {
                    trigger: "item"
                },
                title: {
                    text: "城市销量",
                    left: "45%",
                    textStyle: {
                        color: "#fff",
                        fontSize: 20,
                        textShadowBlur: 10,
                        textShadowColor: "#33ffff"
                    }
                },
                // 视觉映射效果
                visualMap: {
                    type: "continuous",
                    min: 100,
                    max: 5000,
                    // 开启滑动效果
                    calculable: true,
                    inRange: {
                        color: ["#50a3ba", "#eac736", "#d94e5d"]
                    },
                    textStyle: {
                        color: "#fff"
                    }
                },
                series: [
                    {
                        // 地图上设置散点图标记点
                        type: "scatter",
                        itemStyle: {
                            color: "red"
                        },
                        // 指定使用的是地理坐标
                        coordinateSystem: "geo",
                        data: [
                            {
                                name: "北京",
                                value: [116.46, 39.92, 4367]
                            },
                            {
                                name: "上海",
                                value: [121.48, 31.22, 8675]
                            },
                            {
                                name: "深圳",
                                value: [114.07, 22.62, 2461]
                            },
                            {
                                name: "广州",
                                value: [113.23, 23.16, 187]
                            },
                            {
                                name: "西安",
                                value: [108.45, 34, 3421]
                            }
                        ]
                    }
                ]
            })
          })
      });

      return {
          getState,
          mapData
      }
  }
}

</script>
<style lang='less' scoped>
.map {
    width: 100%;
    height: 100%;
}
</style>
库存统计饼状图
!<!--  -->
<template>
  <header>
    <h2>
        库存统计
    </h2>
    <div class="chart" id="threeChart">
        图表内容
    </div>
  </header>
</template>

<script>
import { inject, onMounted, reactive } from "vue";
export default {
  setup() {
    let $echarts = inject("echarts");
    let $http = inject("axios");

    // 创建一个对象变量
    let data = reactive({});

    // 请求数据
    async function getState() {
      data = await $http({url: "/three/data"});
      console.log(data);
    }

    onMounted(() => {
      getState().then(() => {
        // init初始化echarts图表
        let myChart = $echarts.init(document.getElementById("threeChart"));
        myChart.setOption({
          // 设置图例
          legend: {
            top: "bottom"
          },
          // 聚焦显示提示框
          tooltip: {
            show: true
          },
          series: [
            {
              type: "pie",
              data: data.data.chartData.chartData,
              // 内外圆角
              radius: [10, 100],
              center: ["50%", "45%"],
              roseType: "area",
              itemStyle: {
                borderRadius: 10
              }
            }
          ]
        })
      })
    })

    return {
      getState,
      data
    }
  }
}

</script>
<style lang='less' scoped>
.chart {
  height: 4.375rem;
}
h2 {
  height: .3125rem;
  color: #fff;
  line-height: .3125rem;
  font-size: .25rem;
  text-align: center;
}
</style>
堆叠折线图
!<!--  -->
<template>
  <header>
    <h2>
        周销图
    </h2>
    <div class="chart" id="twoChart">
        图表内容
    </div>
  </header>
</template>

<script>
import { inject, onMounted, reactive } from "vue";
export default {
  setup() {
    let $echarts = inject("echarts");
    let $http = inject("axios");

    // 创建一个对象变量
    let data = reactive({});

    // 请求数据
    async function getState() {
      data = await $http({url: "/two/data"});
      console.log(data);
    }

    onMounted(() => {
      getState().then(() => {
        // init初始化echarts图表
        let myChart = $echarts.init(document.getElementById("twoChart"));
        myChart.setOption({
          // 悬浮提示框
          tooltip: {
            trigger: "axis",
            axisPointer: {
              type: "cross",
              label: {
                backgroundColor: "#e6b600"
              }
            }
          },
          legend: {
            data: ["服饰", "数码", "家电", "家居", "日化"]
          },
          // 设置图表距离
          grid: {
            left: "1%",
            right: "4%",
            bottom: "3%",
            containLabel: true
          },
          xAxis: {
            type: "category",
            // 使起点与Y轴无间隙
            boundaryGap: false,
            data: data.data.chartData.chartData.day,
            axisLine: {
              lineStyle: {
                color: "#fff"
              }
            }
          },
          yAxis: {
            type: "value",
            axisLine: {
              lineStyle: {
                color: "#fff"
              }
            }
          },
          series: [
            {
              name: "服饰",
              type: "line",
              data: data.data.chartData.chartData.num.Clothes,
              // 使折线平滑
              smooth: true,
              // 隐藏折点
              showSymbol: false,
              // 使数据堆叠
              stack: "Total",
              // 隐藏区域最上方的线段
              lineStyle: {
                width: 0
              },
              // 选中区域高亮
              emphasis: {
                focus: "series"
              },
              // 填充区域样式
              areaStyle: {
                opacity: 0.8,
                // 配置渐变颜色
                color: new $echarts.graphic.LinearGradient(0, 0, 0, 1, [
                  {
                  offset: 0,
                  color: "rgb(128, 255, 165)"
                  },
                  {
                    offset: 1,
                    color: "rgb(1, 191, 236)"
                  }
                ])
              }
            },
            {
              name: "数码",
              type: "line",
              data: data.data.chartData.chartData.num.digit,
              smooth: true,
              showSymbol: false,
              stack: "Total",
              lineStyle: {
                width: 0
              },
              emphasis: {
                focus: "series"
              },
              areaStyle: {
                opacity: 0.8,
                color: new $echarts.graphic.LinearGradient(0, 0, 0, 1, [
                  {
                  offset: 0,
                  color: "rgb(0, 221, 255)"
                  },
                  {
                    offset: 1,
                    color: "rgb(77, 119, 255)"
                  }
                ])
              }
            },
            {
              name: "家电",
              type: "line",
              data: data.data.chartData.chartData.num.Electrical,
              smooth: true,
              showSymbol: false,
              stack: "Total",
              lineStyle: {
                width: 0
              },
              emphasis: {
                focus: "series"
              },
              areaStyle: {
                opacity: 0.8,
                color: new $echarts.graphic.LinearGradient(0, 0, 0, 1, [
                  {
                  offset: 0,
                  color: "rgb(55, 162, 255)"
                  },
                  {
                    offset: 1,
                    color: "rgb(116, 21, 219)"
                  }
                ])
              }
            },
            {
              name: "家居",
              type: "line",
              data: data.data.chartData.chartData.num.gear,
              smooth: true,
              showSymbol: false,
              stack: "Total",
              lineStyle: {
                width: 0
              },
              emphasis: {
                focus: "series"
              },
              areaStyle: {
                opacity: 0.8,
                color: new $echarts.graphic.LinearGradient(0, 0, 0, 1, [
                  {
                  offset: 0,
                  color: "rgb(255, 0, 135)"
                  },
                  {
                    offset: 1,
                    color: "rgb(135, 0, 157)"
                  }
                ])
              }
            },
            {
              name: "日化",
              type: "line",
              data: data.data.chartData.chartData.num.Chemicals,
              smooth: true,
              showSymbol: false,
              stack: "Total",
              lineStyle: {
                width: 0
              },
              emphasis: {
                focus: "series"
              },
              areaStyle: {
                opacity: 0.8,
                color: new $echarts.graphic.LinearGradient(0, 0, 0, 1, [
                  {
                  offset: 0,
                  color: "rgb(255, 191, 0)"
                  },
                  {
                    offset: 1,
                    color: "rgb(224, 62, 76)"
                  }
                ])
              }
            },
          ]
        })
      })
    });

    return {
      getState,
      data
    }

  }
}

</script>
<style lang='less' scoped>
.chart {
  height: 4.375rem;
}
h2 {
  height: .3125rem;
  color: #fff;
  line-height: .3125rem;
  font-size: .25rem;
  text-align: center;
}
</style>
堆叠柱状图
!<!--  -->
<template>
  <header>
    <h2>
        产品类别
    </h2>
    <div class="chart" id="fourChart">
        图表内容
    </div>
  </header>
</template>

<script>
import { inject, onMounted, reactive } from "vue";
export default {
  setup () {
    let $echarts = inject("echarts");
    let $http = inject("axios");

    // 创建一个对象变量
    let data = reactive({});

    // 请求数据
    async function getState() {
      data = await $http({url: "/four/data"});
      console.log(data);
    }

    onMounted(() => {
      getState().then(() => {
        // init初始化echarts图表
        let myChart = $echarts.init(document.getElementById("fourChart"));
        myChart.setOption({
          // 设置图表距离
          grid: {
            left: "3%",
            right: "4%",
            bottom: "3%",
            containLabel: true
          },
          xAxis: {
            type: "category",
            data: data.data.chartData.chartData.day,
            axisLine: {
              lineStyle: {
                color: "#fff"
              }
            }
          },
          yAxis: {
            type: "value",
            axisLine: {
              lineStyle: {
                color: "#fff"
              }
            }
          },
          legend: {},
          // 悬浮提示框
          tooltip: {
            trigger: "axis",
            axisPointer: {
              type: "shadow"
            }
          },
          series: [
            {
              name: "服饰",
              type: "bar",
              data: data.data.chartData.chartData.num.Clothes,
              // 堆叠柱状图
              stack: "total",
              label: {
                show: true
              },
              emphasis: {
                focus: "series"
              },
            },
            {
              name: "数码",
              type: "bar",
              data: data.data.chartData.chartData.num.digit,
              // 堆叠柱状图
              stack: "total",
              label: {
                show: true
              },
              emphasis: {
                focus: "series"
              },
            },
            {
              name: "家电",
              type: "bar",
              data: data.data.chartData.chartData.num.Electrical,
              // 堆叠柱状图
              stack: "total",
              label: {
                show: true
              },
              emphasis: {
                focus: "series"
              },
            },
            {
              name: "家居",
              type: "bar",
              data: data.data.chartData.chartData.num.gear,
              // 堆叠柱状图
              stack: "total",
              label: {
                show: true
              },
              emphasis: {
                focus: "series"
              },
            },
            {
              name: "日化",
              type: "bar",
              data: data.data.chartData.chartData.num.Chemicals,
              // 堆叠柱状图
              stack: "total",
              label: {
                show: true
              },
              emphasis: {
                focus: "series"
              },
            },
          ]
        })
      })
    });

    return {
      data,
      getState
    }
  }
}

</script>
<style lang='less' scoped>
.chart {
  height: 4.375rem;
}
h2 {
  height: .3125rem;
  color: #fff;
  line-height: .3125rem;
  font-size: .25rem;
  text-align: center;
}
</style>
项目打包
浏览器无法识别vue语法,因此首先需要解析为浏览器认识的htmlcssjs
方法为打包
npm run build
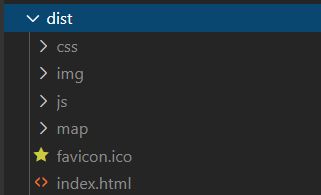
生成dist文件夹,点开html文件,报资源找不到的错误
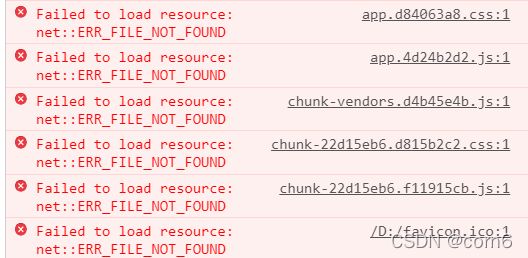
原因就是路径找不到了
因此需要配置静态资源路径
方法,新建一个vue.config.js
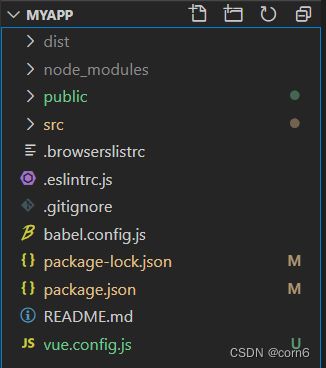
publicPath就是用于配置静态资源路径的
module.exports = {
    lintOnSave: false,
    // 配置静态资源路径
    // 全局变量process表示当前进程,env表示当前系统环境信息
    // 而NODE_ENV是我们用户自己定义的变量,用于判断当前为生产模式,或开发模式
    publicPath: process.env.NODE_ENV === "production" ? "./" : "/"
}
然后重新build,这次只能出现背景图
原因是,路由使用的是history模式的,需要改为hash模式
import { createRouter, createWebHashHistory } from 'vue-router'

const router = createRouter({
  history: createWebHashHistory(process.env.BASE_URL),
  routes
})
重新Build后除了地图其他都能显示,原因是地图用了localhost地址读取的本地json文件
地图设置与打包
将地图也改为请求8080端口的后台方式获取
在server文件夹,下的router文件夹,新建一个map.js配置获取地图json文件的路由,把china.json放到mock文件夹下
let express = require("express");
// 实现路由功能
let router = express.Router();
let mapData = require("../mock/china.json");

// 第一个参数,路由地址
// 第二个参数,回调函数;req请求,res响应
router.get("/data", (req, res) => {
    // 向前台响应内容
    res.send({msg: "我是map的路由地址", chinaData: mapData});
})

module.exports = router;
然后在index.js里面引用路由文件
回到前台的mapPage.vue,把路径重新配置成请求server
let $http = inject("axios");

      async function getState() {
          mapData = await $http.get("/map/data");
      }
然后重新build即可
