matlab
Matlab画图
- 1. 折线图
-
- 1.1 Matlab折线图--入门
- 1.2 Matlab折线图--局部放大
- 1.3 Matlab折线图--x轴坐标值不均匀
- 1.4 Matlab折线图--y轴坐标值不均匀
- 1.5 Matlab折线图--多个子图
- 1.6 Matlab折线图--subplot
- 1.7 matlab 两个图共用一个横坐标轴 yyaxis
- 1.8 matlab 两个图y轴一致
1. 折线图
1.1 Matlab折线图–入门
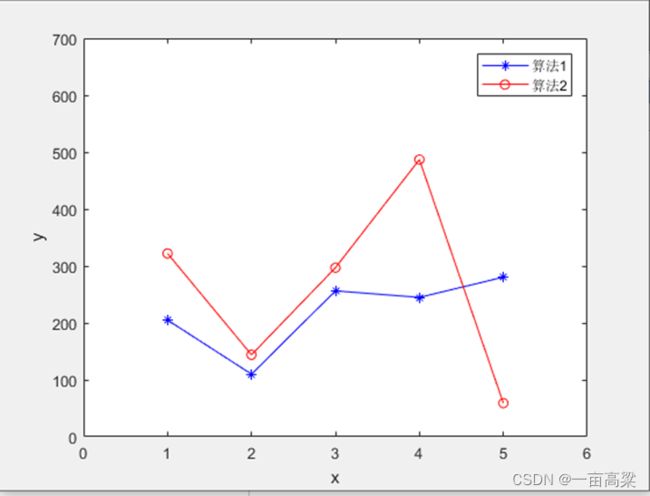
%% 数据
x=[1 2 3 4 5];%x轴上的数据,第一个值代表数据开始,第二个值代表间隔,第三个值代表终止
a=[205,110,256.250,244.885,280.355]; %a数据y值
b=[322,144,297,487,59]; %b数据y值

%% 画图
plot(x,a,'-*b',x,b,'-or'); %线性,颜色,标记
axis([0,6,0,700])  %确定x轴与y轴框图大小
set(gca,'XTick',[0:1:6]) %x轴范围1-6,间隔1
set(gca,'YTick',[0:100:700]) %y轴范围0-700,间隔100
legend('算法1','算法2');   %右上角标注
xlabel('x')  %x轴坐标描述
ylabel('y')  %y轴坐标描述
1.2 Matlab折线图–局部放大
clc;clear;close all;
x=0:10;
y1 = x.^2 + 2 ;
y2 = x.^2 + x + 2;
plot(x,y1,'m-p',x,y2,'b-s','linewidth',2);% 原始大图
legend('y1','y2');

%% 局部放大
axes('Position',[0.18,0.62,0.28,0.25]); % 生成子图
plot(x,y1,'m-p',x,y2,'b-s','linewidth',2);
axis([0 2 0 5]);  % 想要局部放大细节的 横坐标范围 与 纵坐标范围
saveas(gcf,sprintf('Original image.jpg'),'bmp'); %保存图片
- 第8行参数[0.18,0.62,0.28,0.25]; 分别表示左下角归一化坐标x,y,归一化宽高w,h
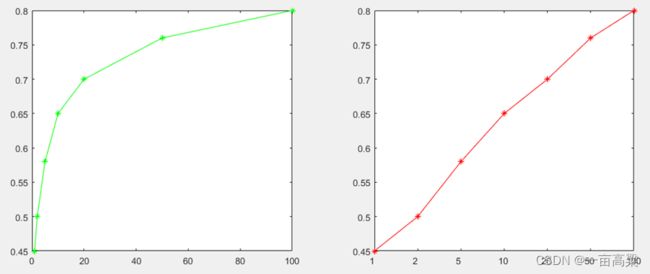
1.3 Matlab折线图–x轴坐标值不均匀
x1=[1 2 5 10 20 50 100];
x=[1 2 3 4 5 6 7];
y=[0.45 0.5 0.58 0.65 0.7 0.76 0.8];
subplot(1,2,1); % 原始图
plot(x1,y,'g-*');
subplot(1,2,2); % 目标图
plot(x,y,'r-*');
set(gca,'xtick',x); % 设置x轴的值
set(gca,'xticklabel',x1);% 设置x轴显示的值
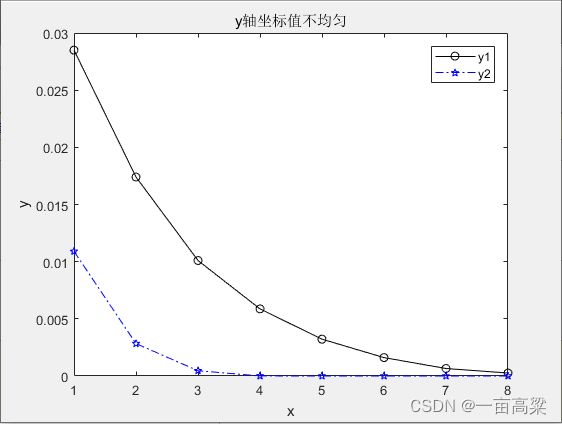
1.4 Matlab折线图–y轴坐标值不均匀
clc;clear;close all;
%% data
x = [1:1:8];
y1 =[1.09E-2,  2.83E-3, 4.62E-4,  6.10E-6,   3.82E-6,  0,       0,         0];
y2 =[2.85E-2   1.74E-2  1.01E-2   5.87E-3	3.22E-3   1.61E-3  6.56E-4	  2.60E-4];

%% plot
plot(x,y1,'k-o',x,y2,'b-.p');%同一张图上绘制

%% set
xlabel('x'), ylabel('y');
legend('y1','y2');
title('y轴坐标值不均匀');
效果图
clc;clear;close all;
%% data
x = 1:1:8;
y1 =[2.85E-2   1.74E-2  1.01E-2   5.87E-3	3.22E-3   1.61E-3  6.56E-4	  2.60E-4];
y2 =[1.09E-2,  2.83E-3, 4.62E-4,  6.10E-6,   3.82E-6,  0,       0,         0];

%% plot
fig=figure('unit','centimeters','position',[10,5,29.7,21],'PaperPosition',[0, 0, 29.7,21],'PaperSize',[29.7,21]); % A4 paper
plot(x,y1,'k-o',x,y2,'b-.p');%同一张图上绘制
% set(gca,'yticklabel',{'1E-6','1E-5','1E-4','1E-3','1E-2','1E-1'}) %设置Y坐标轴刻度处显示的字符

%% set
set(gca,'ytick',[1E-6,1E-5,1E-4,1E-3,1E-2,1E-1]);%纵坐标设置
set(gca,'yscale','log');%取对数实现纵坐标不均匀分布
xlabel('x'), ylabel('y');
legend('y1','y2');
title('y轴坐标值均匀');

%% save
print(gcf, '-dpdf', 'figure1.pdf')  % print to pdf document
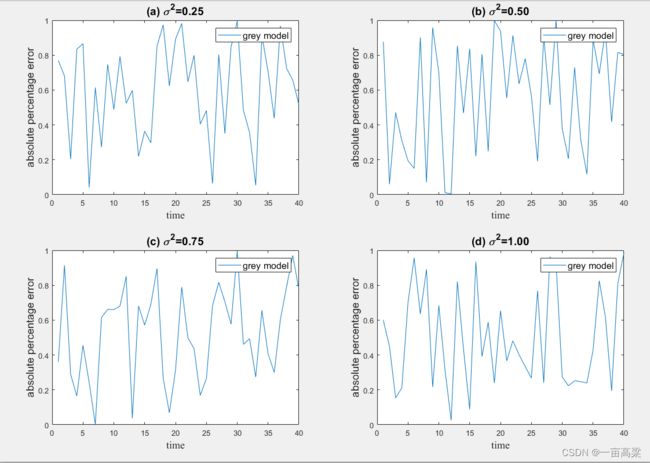
1.5 Matlab折线图–多个子图
%% clear screen variabes figure
clc;clear;close all;
%% random gernerate data
data=rand(40,4);
[~,l]=size(data);
%% control figure and coordinate axis position
% position control figure position and size
% PaperSize control paper size
% PaperPosition control print position and size
fig=figure('unit','centimeters','position',[10,5,29.7,21],'PaperPosition',[0, 0, 29.7,21],'PaperSize',[29.7,21]); % A4 paper
% coordinate axis position and size, a vector represent position and size
pos=[0.08,0.58,0.38,0.38; 0.58,0.58,0.38,0.38;0.08,0.08,0.38,0.38;0.58,0.08,0.38,0.38  ];
title0=['(a) \sigma^2=0.25';'(b) \sigma^2=0.50';'(c) \sigma^2=0.75';'(d) \sigma^2=1.00'];
for i=1:l %
    figh=axes('position',pos(i,:));
    plot(data(:,i));
    xlabel({'time'},'Fontname', 'Times New Roman','FontSize',13.2);
    ylabel({'absolute percentage error'},'FontSize',13.2);
    title(title0(i,:),'FontWeight','bold','FontSize',14);
    legend({'grey model'},'FontSize',12,'Location','northeast')
end
%% save figure
%savefig(fig,'figure_size_control.fig');
print(fig, '-dpdf', 'figure_size_control.pdf')  % print to pdf document
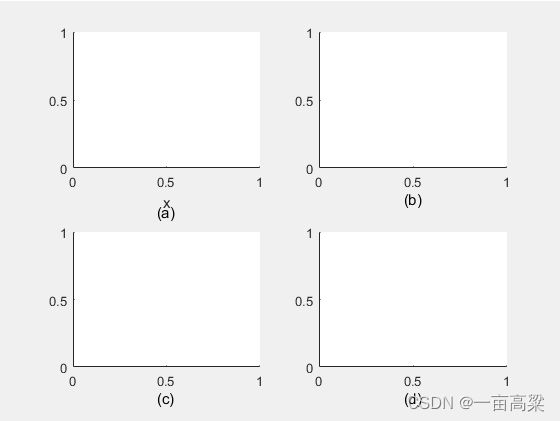
1.6 Matlab折线图–subplot
- 子标题和x轴标签的距离需要仔细调整,需要按照模板来调整。
subplot(2,2,1);
xlabel('x'), title('(a)', 'position', [0.5,-0.4])
subplot(2,2,2);
title('(b)', 'position', [0.5,-0.3])
subplot(2,2,3);
title('(c)', 'position', [0.5,-0.3])
subplot(2,2,4);
title('(d)', 'position', [0.5,-0.3])
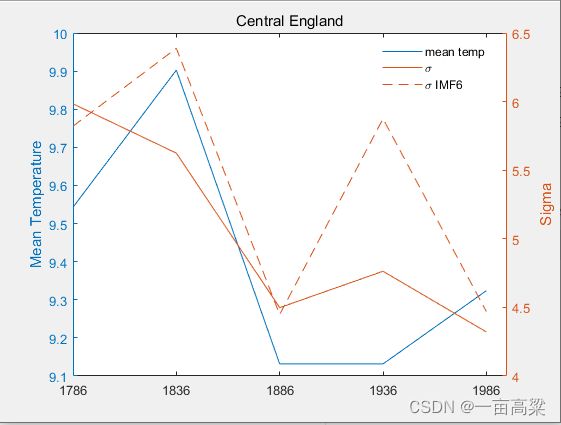
1.7 matlab 两个图共用一个横坐标轴 yyaxis
%% clear
clc;
clear;

%% data
tt1 = [1786, 1836, 1886, 1936, 1986];
yytick2 = ['1786','1836','1886','1936','1986'];
u = 1.2*rand(5,5)+9;
sigma = 2.4.*rand(5,7)+4;

%% plot
yyaxis left;
plot(tt1,u(:,1));
ylabel('Mean Temperature');
yyaxis right;
plot(tt1,sigma(:,[1,7]));
ylabel('Sigma');
title('Central England');
legend({'mean temp','\sigma','\sigma IMF6'},'location','best','box','off');
% set(gca,'xtick',tt1(1:5:end),'xticklabel',yytick2(1:5:end),'xlim',[tt1(1),tt1(end)]);
set(gca,'xtick',tt1,'xticklabel', tt1,'xlim',[1786, 1996]);
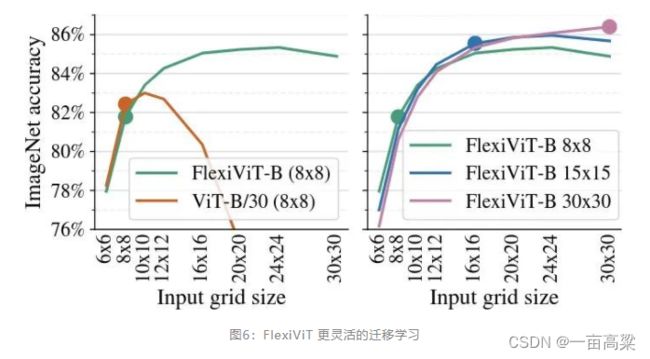
1.8 matlab 两个图y轴一致
%% clear
clc;
clear;

%% data
x=[6 8 10 12 16 20 24 30];
xtl = {'6x6','8x8','10x10','12x12','16x16','20x20','24x24', '30x30'};
y1=rand(8, 1);
y2=rand(8, 1);

%% plot
subplot(1,2,1); % 原始图
plot(x,y1,'g-*');
ylim([0, 1]);
legend({'y1'},'location','best','box','off');
set(gca,'xtick',x, 'xlim', [x(1), x(end)]); % 设置x轴的值
set(gca,'XTickLabel',xtl,'XTickLabelRotation',90,'fontsize',10.5, 'fontname','Times New Roman');

subplot(1,2,2); % 目标图
plot(x,y2,'r-*');
ylim([0, 1]);
legend({'y2'},'location','best','box','off');
set(gca,'xtick',x, 'xlim', [x(1), x(end)]); % 设置x轴的值
set(gca,'XTickLabel',xtl,'XTickLabelRotation',90,'fontsize',10.5, 'fontname','Times New Roman');

