文章目录
-
-
- 1.K-means简介与基本原理
-
- 2.K-means距离计算方法
- 3.K-means代码实现
- 4.Sklearn实现K-means
- 5.层次聚类
-
- 6.sklearn实现层次聚类
- 7.密度聚类
- 8.密度聚类的sklearn代码实现
- 9.高斯混合模型
-
- 10.高斯混合模型代码实现
- 11.高斯混合模型
- 12.案例:对亚洲足球队进行聚类分析
1.K-means简介与基本原理
1)简介
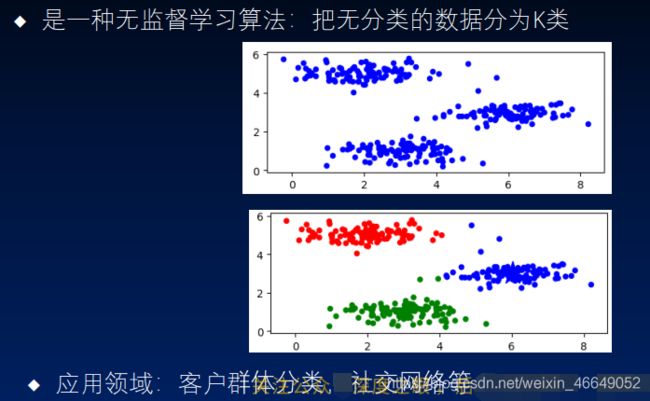
2)基本原理
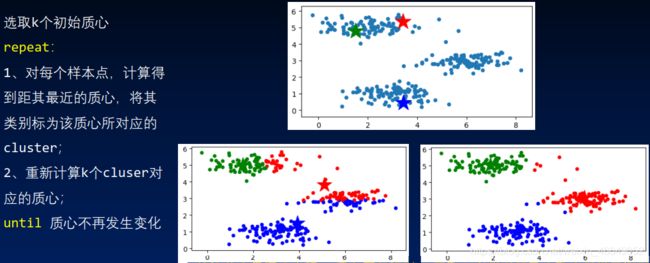
2.K-means距离计算方法
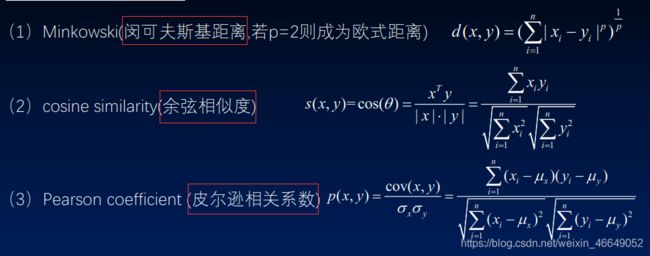
一般使用欧氏距离,作为距离度量
3.K-means代码实现
import matplotlib as mpl
import matplotlib.pyplot as plt
import numpy as np
def loaddata():
data = np.loadtxt('data/cluster_data.csv', delimiter=',')
return data
def kMeansInitCentroids(X, k):
index = np.random.randint(0, X.shape[0], k)
return X[index]
def findClosestCentroids(X, centroids):
idx = np.zeros(X.shape[0]).reshape(X.shape[0], -1)
for i in range(len(X)):
index = 0
minDistance = float('inf')
for k in range(len(centroids)):
distance = np.sum(np.power(X[i] - centroids[k], 2))
if distance < minDistance:
minDistance = distance
index = k
idx[i] = index
return idx
def cmputerCentorids(X, idx):
k = set(np.ravel(idx).tolist())
k = list(k)
centroids = np.ndarray((len(k), X.shape[1]))
for i in range(len(k)):
data = X[np.where(idx == k[i])[0]]
centroids[i] = (np.sum(data, axis=0)) / len(data)
return centroids
def k_means(X, k, max_iters):
initial_centroids = kMeansInitCentroids(X, k)
for i in range(max_iters):
if i == 0:
centroids = initial_centroids
idx = findClosestCentroids(X, centroids)
centroids = cmputerCentorids(X, idx)
return idx, centroids
if __name__ == '__main__':
X = loaddata()
plt.scatter(X[:, 0], X[:, 1], s=20)
idx, centroids = k_means(X, 3, 8)
print('类别为\n', idx)
print('聚类中心为\n', centroids)
cm_dark = mpl.colors.ListedColormap(['g', 'r', 'b'])
plt.scatter(X[:, 0], X[:, 1], c=np.ravel(idx), cmap=cm_dark, s=20)
plt.scatter(centroids[:, 0], centroids[:, 1], c=np.arange(len(centroids)), cmap=cm_dark, s=500)
plt.show()
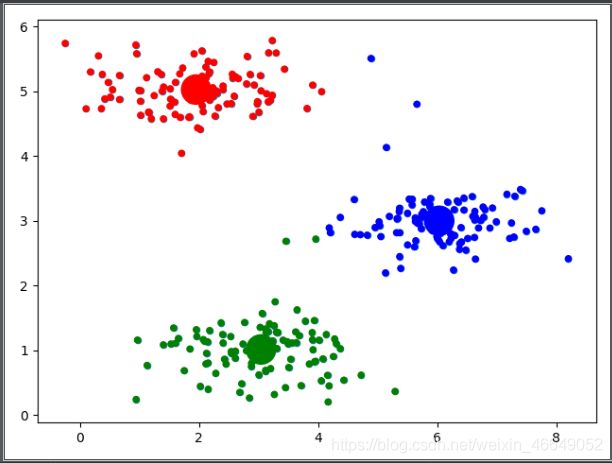
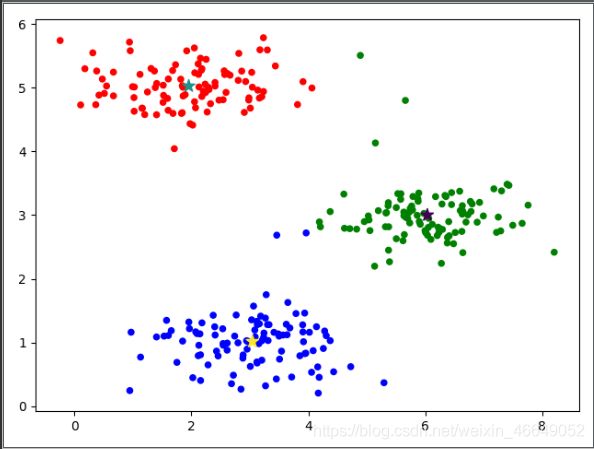
聚类中心为
 [[3.04367119 1.01541041]
 [1.95399466 5.02557006]
 [6.03366736 3.00052511]]
4.Sklearn实现K-means
import matplotlib as mpl
import matplotlib.pyplot as plt
import numpy as np
from sklearn.cluster import KMeans
def loaddata():
data = np.loadtxt('data/cluster_data.csv', delimiter=',')
return data
if __name__ == '__main__':
X = loaddata()
model = KMeans(n_clusters=3, max_iter=10)
model.fit(X)
print('聚类中心为\n', model.cluster_centers_)
print('每个样本所属的族\n', model.labels_)
cm_dark = mpl.colors.ListedColormap(['g', 'r', 'b'])
plt.scatter(X[:, 0], X[:, 1], c=model.labels_, cmap=cm_dark, s=20)
plt.scatter(model.cluster_centers_[:, 0], model.cluster_centers_[:, 1], c=np.arange(len(model.cluster_centers_)),
marker='*', s=100)
plt.show()
聚类中心为
 [[6.03366736 3.00052511]
 [1.95399466 5.02557006]
 [3.04367119 1.01541041]]
每个样本所属的族
 [1 0 0 1 1 1 1 1 1 1 1 1 1 1 1 1 1 1 1 1 1 1 1 1 1 1 1 1 1 1 1 1 1 1 1 1 1
 1 1 1 1 1 1 1 1 1 1 1 1 1 1 1 1 1 1 1 1 1 1 1 1 1 1 1 1 1 1 1 1 1 1 1 1 1
 1 1 1 1 1 1 1 1 1 1 0 1 1 1 1 1 1 1 1 1 1 1 1 1 1 1 2 2 2 2 2 2 2 2 2 2 2
 2 2 2 2 2 2 2 2 2 2 2 2 2 2 2 2 2 2 2 2 2 2 2 2 2 2 2 2 2 2 2 2 2 2 2 2 2
 2 2 2 2 2 2 2 2 2 2 2 2 2 2 2 2 2 2 2 2 2 2 2 2 2 2 2 2 2 2 2 2 2 2 2 2 2
 2 2 2 2 2 2 2 2 2 2 2 2 2 2 2 0 0 0 0 0 0 0 0 0 0 0 0 0 0 0 0 0 0 0 0 0 0
 0 0 0 0 0 0 0 0 0 0 0 0 0 0 0 0 0 2 0 0 0 0 0 0 0 0 0 0 0 0 0 0 0 0 0 0 0
 0 0 0 0 0 0 2 0 0 0 0 0 0 0 0 0 0 0 0 0 0 0 0 0 0 0 0 0 0 0 0 0 0 0 0 0 0
 0 0 0 1]
5.层次聚类
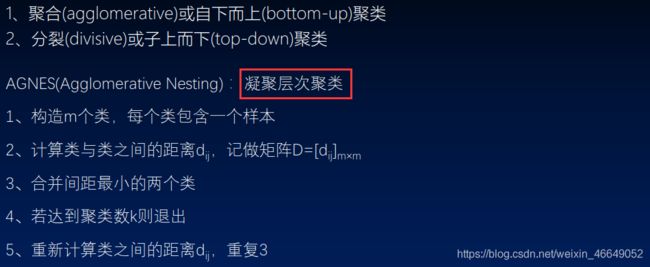
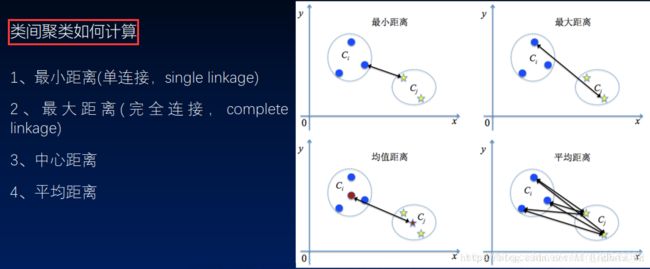
1)原理及距离计算
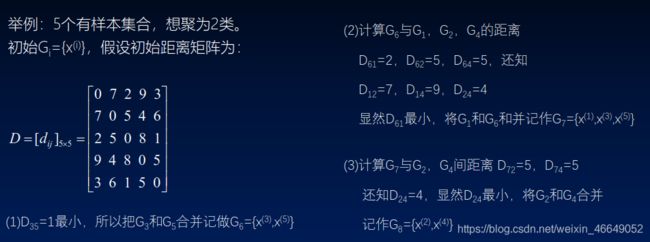
2)层次聚类示例
6.sklearn实现层次聚类
import matplotlib as mpl
import matplotlib.pyplot as plt
import numpy as np
from sklearn.cluster import AgglomerativeClustering
def loaddata():
data = np.loadtxt('data/cluster_data.csv', delimiter=',')
return data
if __name__ == '__main__':
X = loaddata()
model = AgglomerativeClustering(n_clusters=3, affinity='euclidean', linkage='complete')
model.fit(X)
print('每个样本所属的族:\n', model.labels_)
cm_dark = mpl.colors.ListedColormap(['g', 'r', 'b'])
plt.scatter(X[:, 0], X[:, 1], c=model.labels_, cmap=cm_dark, s=20)
plt.show()
每个样本所属的族:
 [1 0 0 1 1 1 1 1 1 1 1 1 1 1 1 1 0 1 1 1 1 1 1 1 1 1 1 1 1 1 1 1 1 1 1 1 1
 1 1 1 1 1 1 1 1 1 1 0 1 1 1 1 1 1 1 1 1 1 1 1 1 1 1 1 1 1 1 1 1 1 1 1 1 1
 1 1 1 1 1 1 1 1 1 1 0 1 1 1 1 1 1 1 1 1 1 0 1 1 1 1 2 2 2 2 2 2 2 2 2 2 2
 2 2 2 2 2 2 2 2 2 2 2 2 2 2 2 2 2 2 2 2 2 2 2 2 2 2 2 2 2 2 2 2 2 2 2 2 2
 2 2 2 2 2 2 2 2 2 2 2 2 2 2 2 2 2 2 2 2 2 2 2 2 2 2 2 2 2 2 2 2 2 2 2 2 2
 2 2 2 2 2 2 2 2 2 2 2 2 2 2 2 0 0 0 0 0 0 0 0 0 0 0 0 0 0 0 0 0 0 0 0 0 0
 0 0 0 0 0 0 0 0 0 0 0 0 0 0 0 0 0 0 0 0 0 0 0 0 0 0 0 0 0 0 0 0 0 0 0 0 0
 0 0 0 0 0 0 0 0 0 0 0 0 0 0 0 0 0 0 0 0 0 0 0 0 0 0 0 0 0 0 0 0 0 0 0 0 0
 0 0 0 1]
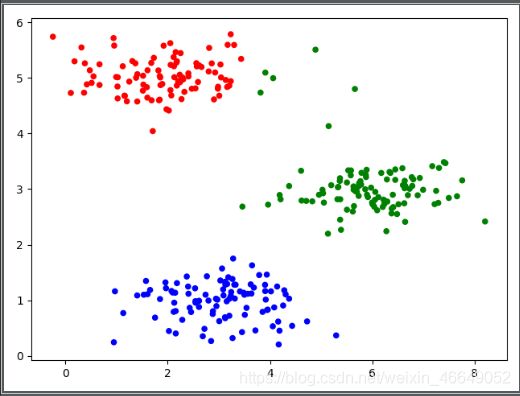
7.密度聚类
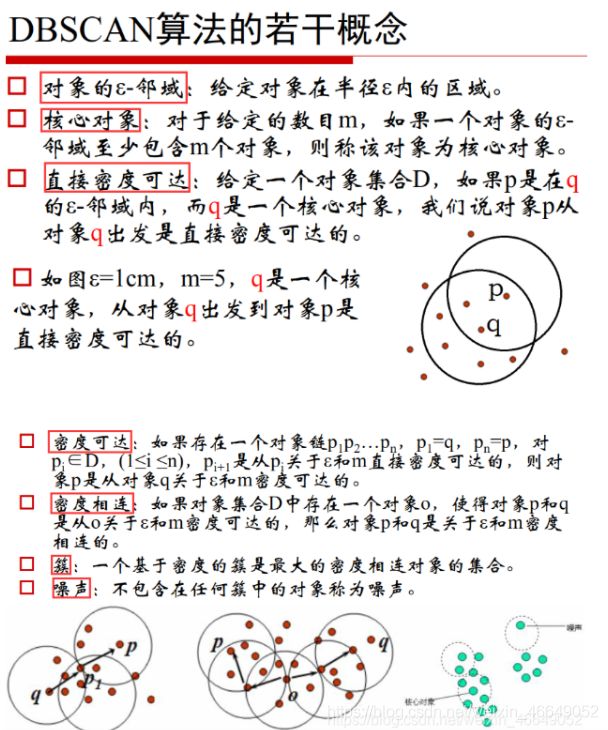
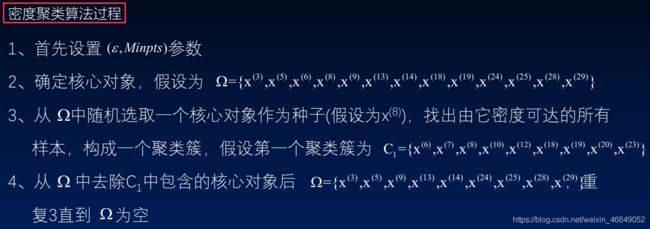
密度聚类方法通常是通过样本分布的紧密程度来进行聚类的
密度聚类算法从样本的密度角度考虑样本之间的可连接性,并基于可连接样本不断扩展聚类,最后形成聚类结果
概念:
对象的邻域eps
核心对象
密度可达
密度直达
8.密度聚类的sklearn代码实现
import numpy as np
import matplotlib as mpl
import matplotlib.pyplot as plt
from sklearn.cluster import DBSCAN
def loaddata():
data = np.loadtxt('data/cluster_data.csv', delimiter=',')
return data
if __name__ == '__main__':
X = loaddata()
model = DBSCAN(eps=0.5, min_samples=5, metric='euclidean')
model.fit(X)
print('每个样本所属的族:', model.labels_)
cm_dark = mpl.colors.ListedColormap(['g','r','b','c'])
plt.scatter(X[:,0],X[:,1],c= model.labels_,cmap=cm_dark,s=20)
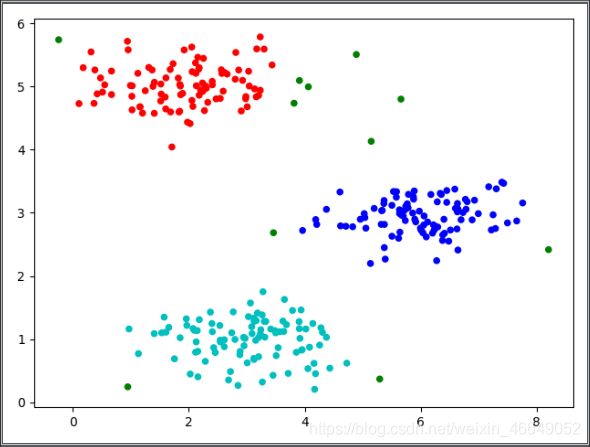
plt.show()
每个样本所属的族: [ 0 -1  1  0  0  0  0  0  0  0  0  0  0  0  0  0 -1  0  0  0  0  0  0  0
  0  0  0  0  0  0  0  0  0  0  0  0  0  0  0  0  0  0  0  0  0  0  0 -1
  0  0  0  0  0  0  0  0  0  0  0  0  0  0  0  0  0  0  0 -1  0  0  0  0
  0  0  0  0  0  0  0  0  0  0  0  0 -1  0  0  0  0  0  0  0  0  0  0 -1
  0  0  0  0  2  2  2  2  2  2  2  2  2  2  2  2  2  2  2  2  2  2  2  2
  2  2  2  2  2  2  2  2  2  2  2  2  2  2  2  2  2  2  2  2  2  2  2  2
  2  2  2  2  2  2  2  2  2  2  2  2  2  2  2  2  2  2  2  2  2  2  2  2
  2  2  2  2  2  2  2  2  2  2  2  2  2  2  2  2  2  2  2  2  2  2  2  2
  2  2  2  2 -1  2 -1  2  1  1  1  1  1  1  1  1  1  1  1  1  1  1  1  1
  1  1  1  1  1  1  1  1  1  1  1  1  1  1  1  1  1  1  1  1  1  1  1  1
  1  1  1  1  1  1  1  1  1  1  1  1  1  1  1  1  1  1  1  1  1  1  1  1
  1 -1 -1  1  1  1  1  1  1  1  1  1  1  1  1 -1  1  1  1  1  1  1  1  1
  1  1  1  1  1  1  1  1  1  1  1  0]
9.高斯混合模型
1)高斯混合模型的介绍
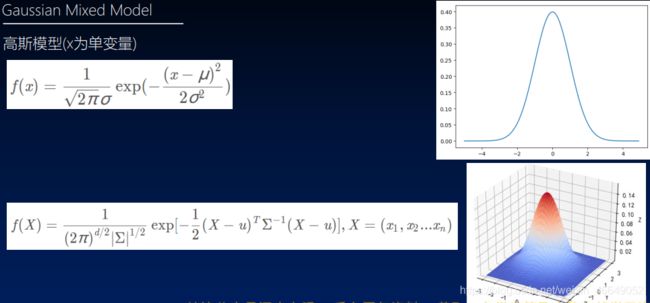
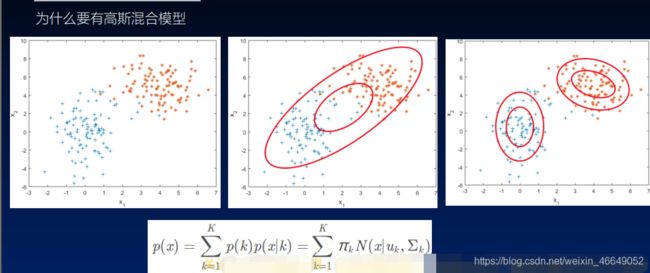
2)高斯混合模型参数估计
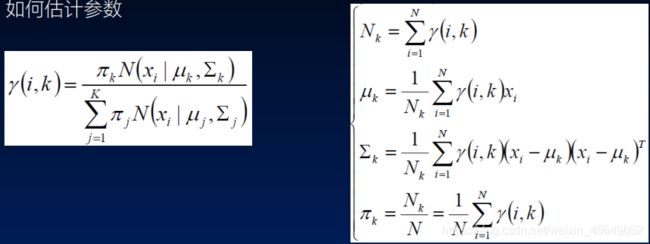
gamma(i,k)表示第i个样本属于第k个类别的概率
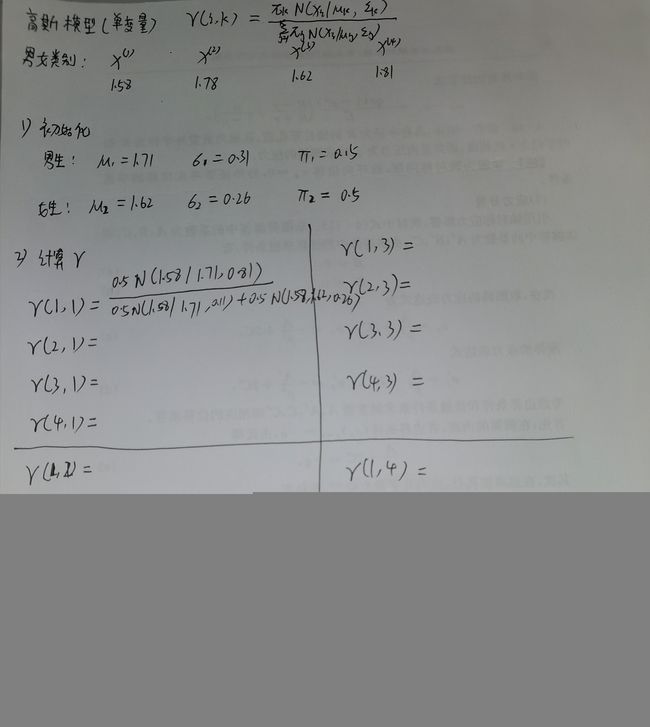
10.高斯混合模型代码实现
import numpy as np
from scipy.stats import multivariate_normal
np.random.seed(0)
mu_m = 1.71
sigma_m = 0.056
num_m = 10000
rand_data_m = np.random.normal(mu_m, sigma_m, num_m)
y_m = np.ones(num_m)
np.random.seed(0)
mu_w = 1.58
sigma_w = 0.051
num_w = 10000
rand_data_w = np.random.normal(mu_w, sigma_w, num_w)
y_w = np.zeros(num_w)
data = np.append(rand_data_m, rand_data_w)
data = data.reshape(-1, 1)
y = np.append(y_m, y_w)
print(data)
print(y)
num_iter = 1000
n, d = data.shape
mu1 = data.min(axis=0)
mu2 = data.max(axis=0)
sigma1 = np.identity(d)
sigma2 = np.identity(d)
pi = 0.5
for i in range(num_iter):
norm1 = multivariate_normal(mu1, sigma1)
norm2 = multivariate_normal(mu2, sigma2)
tau1 = pi * norm1.pdf(data)
tau2 = (1 - pi) * norm2.pdf(data)
gamma = tau1 / (tau1 + tau2)
mu1 = np.dot(gamma, data) / np.sum(gamma)
mu2 = np.dot((1 - gamma), data) / np.sum((1 - gamma))
sigma1 = np.dot(gamma * (data - mu1).T, data - mu1) / np.sum(gamma)
sigma2 = np.dot((1 - gamma) * (data - mu2).T, (data - mu2)) / np.sum(1 - gamma)
pi = np.sum(gamma) / n
print(u'类别概率:\t', pi)
print(u'均值:\t', mu1, mu2)
print(u'方差:\n', sigma1, '\n\n', sigma2, '\n')
[[1.80878693]
 [1.7324088 ]
 [1.76480933]
 ...
 [1.60636048]
 [1.57832104]
 [1.64620368]]
[1. 1. 1. ... 0. 0. 0.]
类别概率:	 0.48738846392845536
均值:	 [1.57749047] [1.70726384]
方差:
 [[0.00244834]]

 [[0.00315184]]
11.高斯混合模型
import numpy as np
from sklearn.metrics import accuracy_score
from sklearn.mixture import GaussianMixture
np.random.seed(0)
mu_m = 1.71
sigma_m = 0.056
num_m = 10000
rand_data_m = np.random.normal(mu_m, sigma_m, num_m)
y_m = np.ones(num_m)
np.random.seed(0)
mu_w = 1.58
sigma_w = 0.051
num_w = 10000
rand_data_w = np.random.normal(mu_w, sigma_w, num_w)
y_w = np.zeros(num_w)
data = np.append(rand_data_m, rand_data_w)
data = data.reshape(-1, 1)
y = np.append(y_m, y_w)
print(data)
print(y)
g = GaussianMixture(n_components=2, covariance_type='full', tol=1e-6, max_iter=1000)
g.fit(data)
print(u'类别概率:\t', g.weights_[0])
print(u'均值:\n', g.means_, '\n')
print(u'方差:\n', g.covariances_, '\n')
y_hat = g.predict(data)
print('准确率:', accuracy_score(y, y_hat))
12.案例:对亚洲足球队进行聚类分析
import pandas as pd
from sklearn.cluster import KMeans
from sklearn.preprocessing import StandardScaler
df = pd.read_csv('data/football_team_data.csv', delimiter=',', index_col='国家')
X = df.values
std = StandardScaler()
X = std.fit_transform(X)
model = KMeans(n_clusters=3, max_iter=10)
model.fit(X)
print('类别标签:\n', model.labels_)
df['聚类结果'] = model.labels_
[[-0.5842676   0.05223517 -0.64677721]
 [-0.97679881 -2.12423024 -1.03291285]
 [-0.9466041  -1.77599577 -1.61211632]
 [-1.76186121 -1.86305439 -0.83984503]
 [-0.76543585 -1.16658546 -0.06757374]
 [-0.04076286  0.05223517 -1.22598067]
 [ 0.26118422  0.05223517  0.51162973]
 [-0.34270994  0.05223517 -0.83984503]
 [-0.13134698  0.05223517 -0.45370938]
 [ 0.89527309  0.05223517  1.28390102]
 [ 0.29137893  0.92282133  1.28390102]
 [-0.16154169  0.92282133  0.31856191]
 [ 0.71410485  0.92282133  0.12549408]
 [ 0.5329366   0.92282133  0.70469755]
 [ 2.16345083  0.92282133  1.28390102]
 [-1.58069297 -0.81835099 -1.80518414]
 [-0.49368348  0.05223517  1.28390102]
 [ 0.77449426  0.92282133 -0.26064156]
 [ 2.042672    0.92282133  0.89776537]
 [ 0.11021068  0.92282133  1.0908332 ]]
类别标签:
 [2 0 0 0 2 2 1 2 2 1 1 1 1 1 1 0 1 1 1 1]


