deap dataset的不同分类模型的实现(4)-MNE基础概念学习
MNE的基础知识
在讲下一段代码前,先理解一下MNE库。它是一个库,帮你做好了一些工作,就像一个黑箱,但你需要知道输入是什么,怎么输入。
raw,epoch,evoked,events都是MNE库定义的,所以想知道他们是什么,需要去看官方文档。
Epochs
MNE-epochs
是什么
Epochs objects are a data structure for representing and analyzing equal-duration chunks of the EEG/MEG signal. Epochs are most often used to represent data that is time-locked to repeated experimental events (such as stimulus onsets or subject button presses), but can also be used for storing sequential or overlapping frames of a continuous signal (e.g., for analysis of resting-state activity; see Making equally-spaced Events arrays). Inside an Epochs object, the data are stored in an array of shape (n_epochs, n_channels, n_times).
-
Epochs对象是一种数据结构,用于表示和分析EEG/MEG信号的等长时间块。
-
Epochs对象存储形状数据(n_epochs, n_channels, n_times)
-
epoch最常用于表示重复实验事件的时间锁定数据(如刺激触发或被试按键)
epochs /ˈepək/ (也称为,trials /ˈtraɪəl/ )
其它理解:
从连续的脑电图信号中提取一些特定时间窗口的信号,这些时间窗口可以称作为epochs.
假设我们有一个长度为60s的信号x,采样频率为1 Hz.脑电信号的矩阵表示为1x60矩阵,如果将信号划分成一些2s的信号,则将有30个epeoch(信号中每2s就是一个epoch)
怎么做
创建Epochs对象方式有三种:
(1)通过Raw对象和事件事件点(event times)
(2)通过读取.fif文件数据生成Epoch对象
(3)通过mne.EpochsArray从头创建Epoch对象
- 2、读取fif文件创建Epoch对象
步骤:
1)读取fif文件,构建raw对象;
2)创建event对象;
3)创建epoch对象;
4)对epoch进行叠加平均得到evoked对象;
5)绘制evoked。
- 3、原生数据创建
import numpy as np
import neo
import mne
import matplotlib.pyplot as plt
"""
设置event id,用来识别events.
"""
event_id = 1
# 第一列表示样本编号
events = np.array([[200, 0, event_id],
[1200, 0, event_id],
[2000, 0, event_id]]) # List of three arbitrary events
sfreq = 1000 # 采样频率
times = np.arange(0, 10, 0.001) # Use 10000 samples (10s)
sin = np.sin(times * 10) # 乘以 10 缩短周期
cos = np.cos(times * 10)
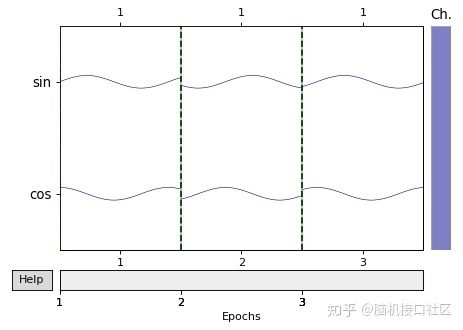
"""
利用sin和cos创建一个2个通道的700 ms epochs的数据集
只要是(n_epochs, n_channels, n_times)形状的数据,都可以被用来创建
"""
epochs_data = np.array([[sin[:700], cos[:700]],
[sin[1000:1700], cos[1000:1700]],
[sin[1800:2500], cos[1800:2500]]])
ch_names = ['sin', 'cos']
ch_types = ['mag', 'mag']
info = mne.create_info(ch_names=ch_names, sfreq=sfreq, ch_types=ch_types)
epochs = mne.EpochsArray(epochs_data, info=info, events=events,
event_id={'arbitrary': 1})
epochs.plot(scalings='auto' )
plt.show()
Evoked
MNE-Evoked
是什么
官方原文
-
Evoked objects typically store an EEG or MEG signal that has been averaged over multiple epochs, which is a common technique for estimating stimulus-evoked activity.
-
The data in an Evoked object are stored in an array of shape (n_channels, n_times) (in contrast to an Epochs object, which stores data of shape (n_epochs, n_channels, n_times)).
-
Thus to create an Evoked object, we’ll start by epoching some raw data, and then averaging together all the epochs from one condition
-
Evoked储存一组多个epochs平均后的信号。
-
因此Evoked创建需要epochs
-
Evoked储存的结构为(通道,时间点)
其它理解:
诱发电位(Evoked)结构主要用于存储实验期间的平均数据,在MNE中,创建Evoked对象通常使用mne.Epochs.average()来平均epochs数据来实现。
Evoked对象通常存储一个已经被多个epochs平均(averaged)后的EEG或者MEG信号,它是用来评估被刺激诱发的活动(stimulus-evoked activity)的一个常用技术。
怎么做
Evoked数据结构的创建主要有两种方式
1、从Epochs对象中创建Evoked对象
2、从头创建Evoked对象
events
是什么
Events correspond to specific time points in raw data, such as triggers, experimental condition events。
- 是对一段连续的原始数据的划分方法,由特定的时间划分.
- 结构为一个N*3的数组,第一列是采样时间数,第二列通常忽略,第三列是触发事件的整数id
从纵轴看,以通道来区分信号
从横轴看,以events划分信号
4个events重复,为一个epoch。
再从epoch里面截取一段片段为evoke
怎么做
每个events的时间记录,已采样点记录在events类中,
创建方法
1、从已有的数据集获取
2、自己创建
1、直接获取
events = mne.find_events(raw, stim_channel='STI 014')
 采样点数   忽略 events ID
 [ 6994     0     2]
 [ 7086     0     3]
 [ 7192     0     1]
 [ 7304     0     4]
 [ 7413     0     2]
 [ 7506     0     3]
2、自建创建
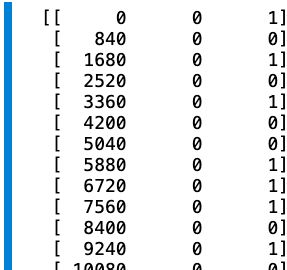
#创建events
events = np.column_stack((np.arange(0,200*840,840),
                          np.zeros(200,dtype=int),
                          labels))
event_dict = dict(condition_A=0, condition_B=1)
print(events)
实践
看一些代码实例吧,理解一下。
参考这篇文章
完整代码
import mne #版本0。23
import scipy
import numpy as np
import scipy.io
import matplotlib.pyplot as plt
from mne.time_frequency import tfr_morlet, psd_multitaper, psd_welch
samplesfile = scipy.io.loadmat('/Users/thrive/Library/Mobile Documents/com~apple~CloudDocs/发文章/code/dataset/classify/S1.mat') #文件读入字典
subjectdata = samplesfile['eeg'] #提取字典中的numpy数组
#加载数据完成,(16840200,16通道每个通道840个采样点,一共200个trial)和二维labels(200*2,这里只用一维标签里的0和1)
#作者没有打印具体数据结构
#先理解为,data结构为[200,16,840],label结构为[200,2],其实后面讲了,一样的
#开始创建epochs
#epochs包括信息描述和数据
#信息描述
sampling_freq=1200 #采样率1200Hz
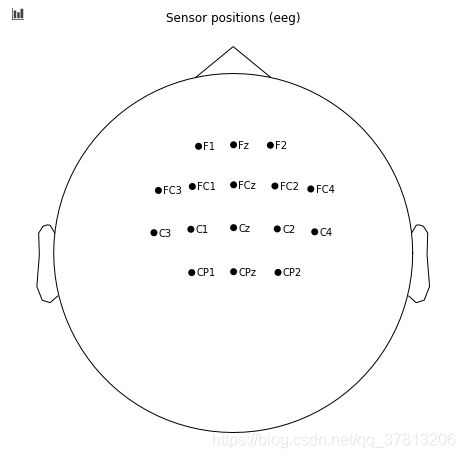
ch_names = ['C1', 'C2', 'C3', 'C4', 'Cz', 'FCz', 'FC1', 'FC2', 'Fz', 'F2', 'F1', 'CPz', 'FC3', 'FC4', 'CP1', 'CP2'] #16个通道名称
ch_types = ['eeg']*16 #16个通道的属性都是eeg
info=mne.create_info(ch_names,ch_types=ch_types,sfreq=sampling_freq) #创建info
info.set_montage('standard_1020') #使用已有的电极国际10-20位置信息
info['description'] = 'My custom dataset' #自定义信息的描述
print(info)
#数据
data=subjectdata['samples'][0][0].transpose((2,0,1))
print(data.shape)
labels=subjectdata['labels'][0][0][:,1]#取了一列
print(labels.shape)
#数据结构确实一样,data结构为[200,16,840],label结构为[200,1]
#创建events
events = np.column_stack((np.arange(0,200*840,840),
np.zeros(200,dtype=int),
labels))
event_dict = dict(condition_A=0, condition_B=1)
print(events)
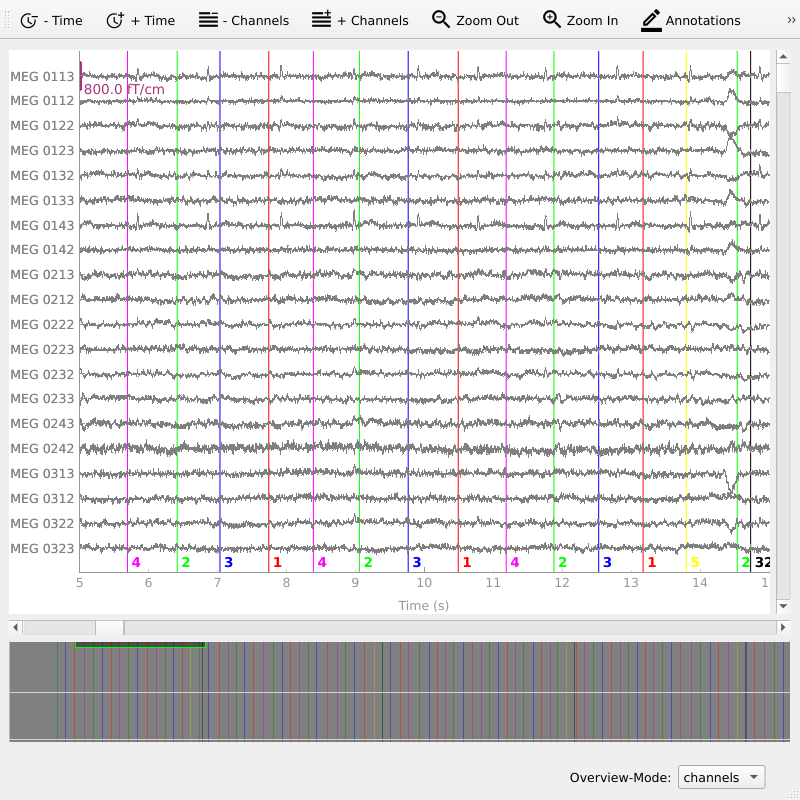
#创建epoch,这里加入了events
simulated_epochs = mne.EpochsArray(data,info,tmin=-0.2,events=events,event_id=event_dict)
simulated_epochs.plot(picks='eeg',show_scrollbars=True,n_epochs=3,scalings=dict(eeg=20), events=events,
event_id=0)
plt.show()#通过events画图
#创建evoked
evocked=simulated_epochs['condition_B'].average()
evocked.plot(picks='C3')
evocked.plot()
plt.show()
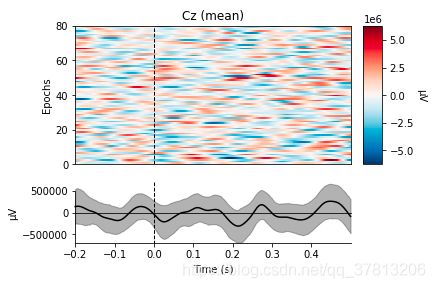
simulated_epochs['condition_A'].plot_image(picks='Cz', combine='mean')
simulated_epochs['condition_B'].plot_image(picks='Cz', combine='mean')
evokeds = dict(A=list(simulated_epochs['condition_A'].iter_evoked()),
B=list(simulated_epochs['condition_B'].iter_evoked()))
mne.viz.plot_compare_evokeds(evokeds, combine='mean', picks='Cz')
simulated_epochs.plot_sensors(ch_type='eeg',show_names='True')
plt.show()
simulated_epochs['condition_A'].plot_psd(fmin=2., fmax=30., average=True, spatial_colors=False)
plt.show()
simulated_epochs['condition_B'].plot_psd(fmin=2., fmax=30., average=True, spatial_colors=False)
plt.show()
几个画图函数学习一下
simulated_epochs['condition_A'].plot_image(picks='Cz', combine='mean')
simulated_epochs['condition_B'].plot_image(picks='Cz', combine='mean')
mne.viz.plot_compare_evokeds(evokeds, combine='mean', picks='Cz')

simulated_epochs.plot_sensors(ch_type='eeg',show_names='True')
这几句不怎么理解,是torch的用法,先不管吧
    def __len__(self):
        return self.data.shape[0]

    def __getitem__(self, idx):
        single_data  = self.data[idx]
        single_label = (self.label[idx] > 5).astype(float)   #convert the scale to either 0 or 1 (to classification problem)

        batch = {
            'data': torch.Tensor(single_data),
            'label': torch.Tensor(single_label)