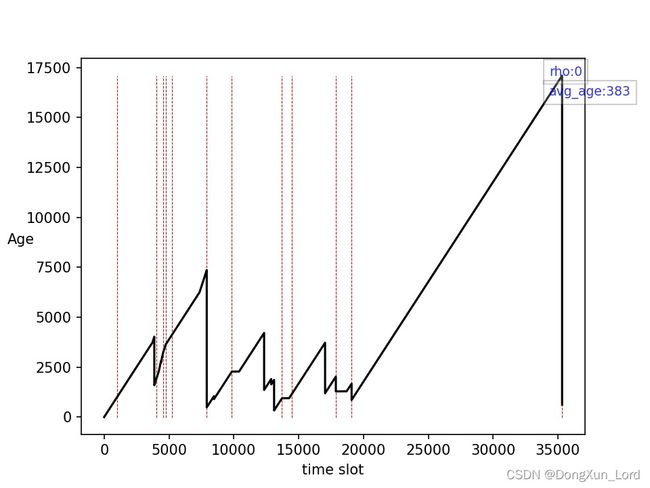
基于FIFO队列的AOI图形绘制
目标: 根据不同的服务时间(传输时间)和间隔到达时间绘制信息的age图形。
# -*- coding: utf-8 -*-
# @Time    : 2022/3/18 14:53
# @Author  : DongXun_Lord
# @FileName: plot_age_fifo.py
# @Software: PyCharm
# -*- coding: utf-8 -*-
import numpy as np
import queue
import copy
import logging
import matplotlib.pyplot as plt
from Configs import *

np.random.seed(526)

# 负载小些,顾客到达时间间隔大,服务率高
# 需要判断生成的传输时间(服务时间)和 ST 的关系
# 应该是服务率高,传输速度快些, ST的值小些
total_time = int(12)
# 到达间隔越大, 表示包到达的间隔越大
IAT_rate = 1
# 服务率越高, 平均传输时间越小
ST_rate = 3

num_processes_served = 0
rho = IAT_rate / ST_rate

# Initialize Parameters
qu = queue.Queue()
server_busy = False
wait_next_p_generate = False
curr_process = None
# num_processes = int(np.random.poisson(IAT_rate) * total_time)
# 固定总数, 改变到达时间
num_processes = 12
age = np.zeros(num_processes)

for i in range(num_processes):
    temp = np.random.exponential(1 / IAT_rate) * 60 * 60
    if i == 0:
        IAT.append(0)
    else:
        IAT.append(int(temp - temp % 1))
# 根据指数分布生成的服务时间, 去除了小数点后的数字作为完整的服务时间 共有=num_processes个ST时间,表示有36个顾客到达
temp = np.random.exponential(1 / ST_rate) * 60 * 60
while not len(ST) == num_processes:
    # 根据指数分布生成的服务时间, 去除了小数点后的数字作为完整的服务时间 共有=num_processes个ST时间,表示有36个顾客到达
    temp = np.random.exponential(1 / ST_rate) * 60 * 60
    if not int(temp - temp % 1) < 1:
        ST.append(int(temp - temp % 1))

# Save a copy of ST
ST_copy = copy.deepcopy(ST)
Wait_Ages = np.zeros(num_processes)
for i in range(num_processes):
    if i == 0:
        AT.append(0)
    else:
        # 顾客到达时间,第一个时间记为0 表示刚刚到达, 利用IAT来计算到达时间!0 + IAT[i] == AT ---> 0 + 445 = 445== AT[1]
        AT.append(AT[i - 1] + IAT[i])
    wait_time.append(0)
print(num_processes, ST_copy, AT)
print(np.average(ST), np.average(IAT))

# Simulation of M/M/1 Queue (i represents current time)
for t in range(total_time * 60 * 60):
    # 经过一轮循环就为True了 表示店里有人!
    if server_busy:
        # 取出来就没有什么等待时间了 ,第一个等待的包put进去后接着就拿出来用作curr_processes
        for item in list(qu.queue):
            wait_time[item] = wait_time[item] + 1
        # curr_process 表示当前客人的到达时间(AT)的索引,服务时间减一
        ST[curr_process] = ST[curr_process] - 1
        if ST[curr_process] == 0:
            server_busy = False
            # 客人服务量加1, 即共服务两位客人。
            num_processes_served = num_processes_served + 1

    # 何时为True? 第一个包服务完毕, 第二个包没有生成, 即第一个包传输期间没有第二个包生成。
    for j in range(num_processes):
        if t == AT[j]:
            qu.put(j)

    # 对于第二种情况,接收了数据后等待多少秒呢? 加一个之前无包提前到达的约束,即当且仅当只有目前的包服务时才计算额外等待时间
    try:
        if ST[curr_process] == 0 and len(qu.queue) == 0:
            wait_next_p_generate = True
        else:
            wait_next_p_generate = False
    except:
        pass
    if wait_next_p_generate and curr_process != num_processes - 1:
        # 当前处理p等待时间继续增加,直到p1到达
        Wait_Ages[curr_process] = Wait_Ages[curr_process] + 1

    if not server_busy and not qu.empty():
        curr_process = qu.get()
        curr_process_ = int(curr_process)
        curr_process_list.append(curr_process_)
        # 初始化第一次运行时,get出的数据为None, 目的是switch into True
        server_busy = True

    for i in range(num_processes):
        if Wait_Ages[i] != 0:
            # 就是字面意思,信息龄,不附加任何其他信息
            age[i] = wait_time[i] + ST_copy[i]
        else:
            age[i] = wait_time[i] + ST_copy[i] + Wait_Ages[i]

# 产生接收- 发送时刻
for i in range(len(age)):
    R_T_slot.append(AT[i] + age[i])

for i in range(len(age) - 1):
    # print(i, num_processes, curr_process_list)
    if Wait_Ages[i] != 0:  # p0传输过程中没有包产生
        # 如果是第一个包和后面的包处理方法是不一样的
        if i == 0:
            # x0 为此类情况的单独传输时间
            x0 = np.arange(ST_copy[i])
            # y0为相应的线性增长
            y0 = np.arange(ST_copy[i])
            # 应为当前服务传输完毕后到下一个包产生的时间
            x1 = np.arange(age[i], Wait_Ages[i] + age[i])
            # y1为相应的数据增长
            y1 = np.arange(age[i], Wait_Ages[i] + age[i])
            down_list.append(age[i])
            # p1 传输时间 x :2290 --- 2290 + age[1] y: 2290 - 3647
            # x2表示此包(p9)产生时间 一直到 此包传输完成
            x2 = np.arange(Wait_Ages[i] + age[i], Wait_Ages[i] + age[i] + ST_copy[i + 1])
            y2 = np.arange(Wait_Ages[i] + age[i], Wait_Ages[i] + age[i] + ST_copy[i + 1])
            x_down0 = [Wait_Ages[i] + age[i] + ST_copy[i + 1] - 1]  # 这里一定要减一才行
            down_list.append(x_down0[0])
            # 这里一定要减一才行
            # 第一个down点是p1的age
            y_down0 = [age[i + 1]]
            x = np.concatenate([x0, x1, x2, x_down0], axis=0)
            y = np.concatenate([y0, y1, y2, y_down0], axis=0)
            x_list.append(x)
            y_true.append(y)
        else:  # 不是第一个 数据包
            # i = 8 x0只是p8传输的时间啊 哥
            x0 = np.arange(R_T_slot[i], R_T_slot[i] + Wait_Ages[i])
            # x0从7852开始, 表示p8',后面跟的就是等待p9产生和p9产生后到接收了,y0应该从p8'down的age开始计数
            y0 = np.arange(age[i], age[i] + Wait_Ages[i])  # 从down线性增加到p9产生的时刻
            # 应为p8传输完毕到p9产生的时间
            x1 = np.arange(R_T_slot[i] + Wait_Ages[i], R_T_slot[i] + Wait_Ages[i] + ST_copy[i + 1])
            y1 = np.arange(age[i] + Wait_Ages[i], age[i] + Wait_Ages[i] + ST_copy[i + 1])
            x_down0_other = [R_T_slot[i] + Wait_Ages[i] + ST_copy[i + 1] - 1]
            y_down0_other = [age[i + 1]]
            x_other = np.concatenate([x0, x1, x_down0_other], axis=0)
            y_other = np.concatenate([y0, y1, y_down0_other], axis=0)
            down_list.append(x_down0_other[0])
            x_list.append(x_other)
            y_true.append(y_other)
    else:
        # 从down点开始计数 一直到p2传输完 到这里 i==1 注意此时第一个down点已经处理完了 ,现在是提前到达的p2开始传输了
        if Wait_Ages[i - 1] != 0:
            x_else0 = np.arange(Wait_Ages[i - 1] + age[i - 1] + age[i],
                                Wait_Ages[i - 1] + age[i - 1] + age[i] + ST_copy[i + 1])
        else:
            # p2(index 0 1 2)属于等待方, 其传输时间即为ST_copy, 接着上p1down的时间点: AT[3] + wait_time[3]==p1开始传输的时间 +ST[2] ===接到了! +
            # St[3]
            x_else0 = np.arange(AT[i] + wait_time[i] + ST_copy[i], AT[i] + wait_time[i] + ST_copy[i] + ST_copy[i + 1])
        # 就是p1 的age到线性增加的最高点,从第一个包down的点==age p1 -----第二个包的传输时间
        # 有了ST其实就是知道了线性增加的 /delta 值了因为包提前到达等待的时间是算到了age里面的,而传输时间从down开始计算就是固定的
        y_else0 = np.arange(age[i] + 1, age[i] + ST_copy[i + 1] + 1)  # 最高点, 这里前方加1,不然同一个坐标轴上有
        # 重复值
        if Wait_Ages[i - 1] != 0:
            x_else_down0 = [Wait_Ages[i - 1] + age[i - 1] + age[i] + ST_copy[i + 1] - 1]
        else:
            x_else_down0 = [AT[i] + wait_time[i] + ST_copy[i] + ST_copy[i + 1] - 1]
        y_else_down0 = [age[i + 1]]
        down_list.append(x_else_down0[0])
        x_ = np.concatenate([x_else0, x_else_down0], axis=0)
        y_ = np.concatenate([y_else0, y_else_down0], axis=0)
        x_list_else.append(x_)
        y_true.append(y_)

# 必须要考虑到维度不一致的问题, 随着循环的增加 x_list and x_list_else的维度必然不同
for i, x in enumerate(x_list_else):
    x_setting[i] = x
for i in range(len(x_list_else)):
    try:
        xx += list(x_setting[i])
    except:
        pass
# ----------------------------------------
# 如何做到有顺序拼接 x好说,y必须是有顺序的
for i, n in enumerate(x_list):
    x_list_setting[i] = n

for i, n in enumerate(y_true):
    y_true_setting[i] = n

for i in range(len(x_list)):
    try:
        xxx += list(x_list_setting[i])
    except:
        pass
for i in range(len(y_true)):
    try:
        yyy += list(y_true_setting[i])
    except:
        pass

x_total = np.sort(np.concatenate([xx, xxx], axis=0))
y_total = np.concatenate([yyy], axis=0)
try:
    plt.vlines([down_list], ymin=-10, ymax=max(yyy), linestyles='dashed', colors='red', linewidth=0.5)
except:
    pass
plt.xlabel("time slot")
avg_age = np.trapz(yyy) / (total_time * 60 * 60 * num_processes)
plt.text(x=max(x_total) - 1000, y=max(yyy), s=f"rho:{int(rho)}", alpha=0.8, size=9, weight='light',
         color='b', bbox=dict(facecolor='w', alpha=0.2))
plt.text(x=max(x_total) - 1000, y=max(yyy) - 1000, s=f"avg_age:{int(avg_age)}", alpha=0.8, size=9, weight='light',
         color='b', bbox=dict(facecolor='w', alpha=0.2))
# plt.text(x=total_time * 50 * 51.5, y=max(yyy), s=f"avg ages:{avg_age}", alpha=0.8, size=7, weight='light', color='b')
plt.ylabel("Age", rotation=0)
plt.plot(x_total, y_total, 'black', linewidth=1.5,)
# plt.legend()
# assert len(down_list) == num_processes
plt.savefig('./results/ages.jpg', dpi=150)
plt.show()
下面是配置代码即Configs
y_true = []
down_list = []
xx = []
xxx = []
yyy = []  # all ages
yy = []
x_setting = {}
y_setting = {}
x_list_setting = {}
y_true_setting = {}
x_list = []
x_list_else = []
y_list = []
y_list_else = []
IAT = []
ST = []  # 服务时刻
AT = []  # 到达时刻
wait_time = []  # 等待时间

curr_process_list = []
list_wait = []
list_age = []
max_wait = []
max_delay = []
ST_Age = []
R_T_slot = []
示例图形:
