python - 科研文献作图复现1
记录阅读文献过程中,通过python复现原文的一些脚本
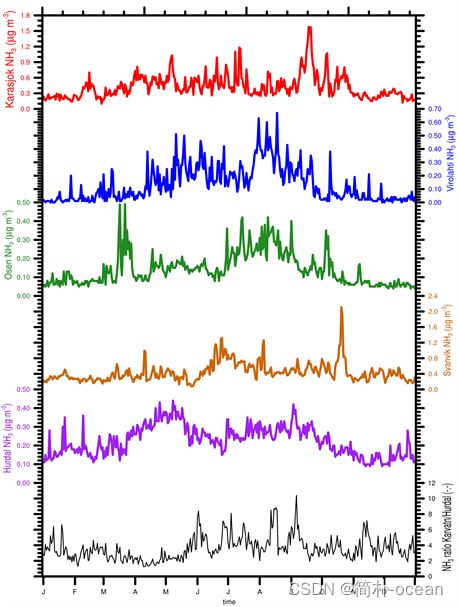
- 想要复现的文章原图如下所示
- https://file.scirp.org/Html/4-2430166_82999.htm
首先,对于原图进行简要观察。
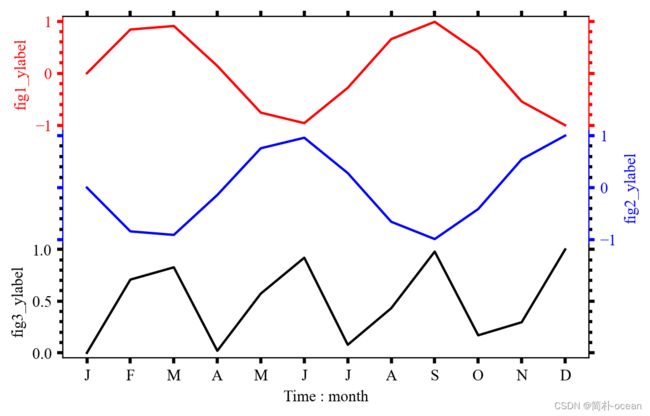
- 这是一张折线图,绘制了6条不同颜色的折线来表示不同变量,横轴的单位统一为时间:月份的英文首字母缩写。比较有意思的是,每个y轴的上限都是不同的,每条曲线对应的标签也是不同的,y轴对应的标签也不同的。同时,每条曲线的y轴将小的间隔也显示出来了。
- 这里简要分析得到:原文作者可能是将6个子图拼接起来,对于各个子图的边框进行一些调整,使得让人感觉是绘制在一张图上。所以,主要解决6个子图无缝连接的问题就可以还原原图了。
- 以下是主要复现的point:
- 多子图上下边界凭借
- 子图y轴显示为不同位置,原本默认在左侧,需要调制至右侧
- 子图y轴标签的颜色
这里主要用到两个库: matplotlib(绘图)、numpy(数据),为了减少代码量,这里仅以3个子图举例。
多子图的拼接
import matplotlib.pyplot as plt
import numpy as np
x = np.arange(0, 12, 1) # 横坐标数据为从0到10之间,步长为0.1的等差数组
y = np.sin(x) # 纵坐标数据为 x 对应的 sin(x) 值
plt.rcParams['font.family'] = 'Times New Roman'
fig, axs = plt.subplots(3, 1, sharex=True,dpi=200)
# Remove horizontal space between axes
fig.subplots_adjust(hspace=0.0)
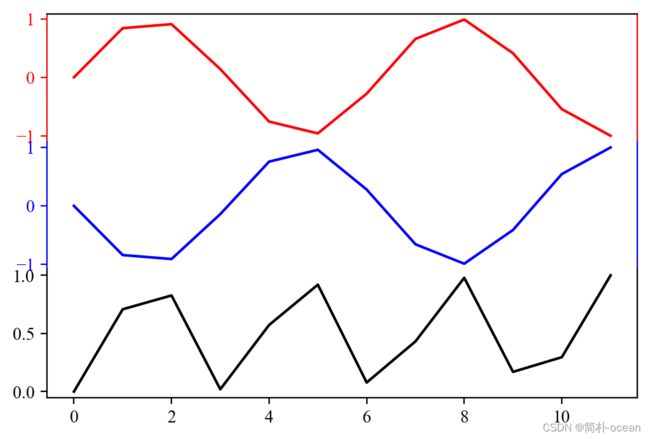
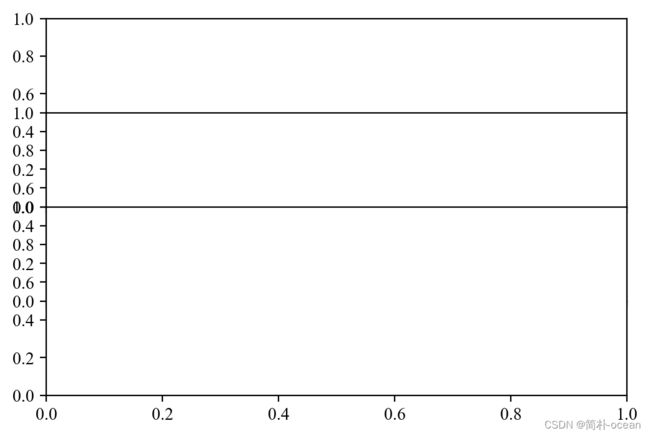
这里,通过调整hspace这个参数就可以实现多子图之间的距离:
hspace=0.0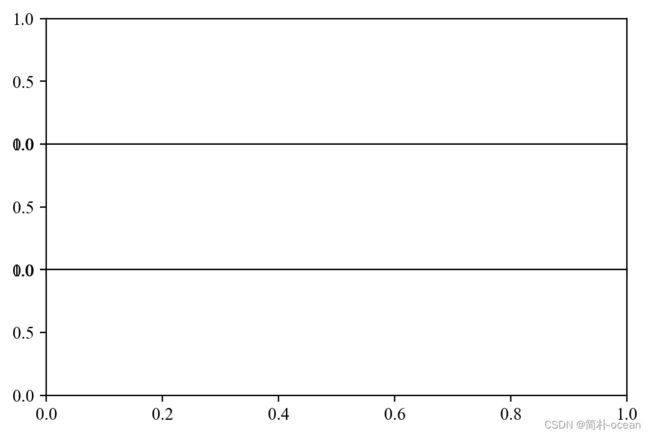
hspace=0.5

hspace=-0.5
调整子图的边框
这里需要将第一个子图的下边框、第二个子图的上下边框、以及第三个子图的上边框设置为不可见:
axs[0].spines['bottom'].set_color('none')
axs[1].spines['bottom'].set_color('none')
axs[1].spines['top'].set_color('none')
axs[2].spines['top'].set_color('none')
这里加了一点额外的内容,将不同子图y轴以及y轴每个单位对应标签的颜色分别设置为红色、蓝色和黑色:
axs[0].spines.left.set_color('r')
axs[0].spines.right.set_color('r')
axs[1].spines.right.set_color('b')
axs[1].spines.left.set_color('b')

axs[0].tick_params(axis='y',colors='r')
axs[1].tick_params(axis='y',colors='b')
axs[2].tick_params(axis='y',colors='k')
x = np.arange(0, 12, 1) # 横坐标数据为从0到10之间,步长为0.1的等差数组
y = np.sin(x) # 纵坐标数据为 x 对应的 sin(x) 值
axs[0].plot( x,y,'r',label='red')
axs[1].plot(x,-y,'b',label='blue')
axs[2].plot(x,y*y,'k',label='black')
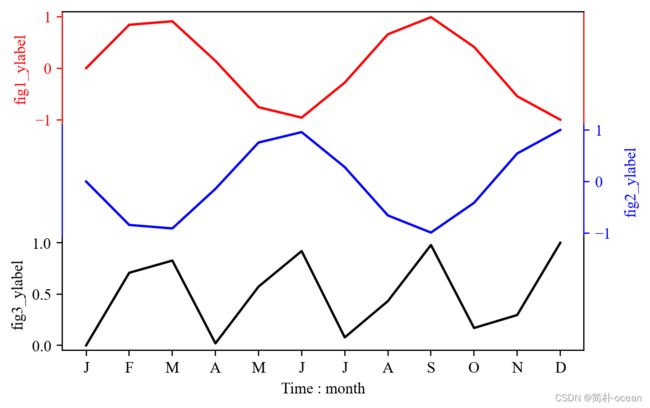
设置y轴单位的位置为右侧,并设置x轴的单位为月份
这里自定义设置x轴的单位,需要注意一个问题,你x轴的array有12个,你对应的xlabels就得是12个,数量要对的上,不然会报错。(可以用空的' '
axs[1].yaxis.set_ticks_position('right')  # axs[0].yaxis.tick_right()
axs[0].set_xticks(x)
axs[0].set_xticklabels(['J','F','M','A','M','J','J','A','S','O','N','D'],rotation=45)
添加y轴的label,并设置y轴的label在子图的右侧
axs[0].set_ylabel('fig1_ylabel',c='r')
axs[1].set_ylabel('fig2_ylabel',labelpad=-370,c='b')
axs[2].set_ylabel('fig3_ylabel')
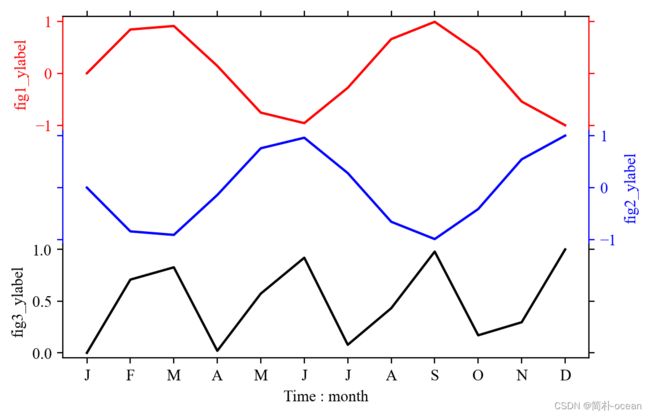
使各个子图的左右上下的边框的tick对称:
axs[0].tick_params(which='major',
                    direction='out',
                    bottom=False, left=True, right=True, top=True)
axs[1].tick_params(which='major',
                    direction='out',
                    bottom=False, left=True, right=True, top=False)
axs[2].tick_params(which='major',
                    direction='out',
                    bottom=True, left=True, right=True, top=False)
设置y轴tick的单位间隔,显示最小的单位间隔
from matplotlib.ticker import AutoMinorLocator, MultipleLocator
axs[0].tick_params(which='minor',
                    direction='out',
                    colors='r')
for i ,ax in enumerate(axs):
    print(i)
    ax.tick_params(which='both',
                        direction='out',
                        left=True, right=True,
                        width=2,
                        )
    ax.yaxis.set_minor_locator(AutoMinorLocator(5))
import matplotlib.pyplot as plt
import numpy as np


def plot_line():

    plt.rcParams['font.family'] = 'Times New Roman'
    fig, axs = plt.subplots(3, 1, sharex=True,dpi=200)
    # Remove horizontal space between axes
    fig.subplots_adjust(hspace=0)
    #################################################################################
    ####                            set  spines color
    #################################################################################
    axs[0].spines['bottom'].set_color('none')
    axs[1].spines['bottom'].set_color('none')

    axs[1].spines['top'].set_color('none')
    axs[2].spines['top'].set_color('none')
    axs[0].spines.left.set_color('r')
    axs[0].spines.right.set_color('r')
    axs[1].spines.right.set_color('b')
    axs[1].spines.left.set_color('b')

    axs[0].tick_params(axis='y',colors='r')
    axs[1].tick_params(axis='y',colors='b')
    axs[2].tick_params(axis='y',colors='k')
    #################################################################################
    ####                             plot line
    #################################################################################

    x = np.arange(0, 12, 1) # 横坐标数据为从0到10之间,步长为0.1的等差数组
    y = np.sin(x) # 纵坐标数据为 x 对应的 sin(x) 值
    axs[0].plot( x,y,'r',label='red')
    axs[1].plot(x,-y,'b',label='blue')
    axs[2].plot(x,y*y,'k',label='black')
    #################################################################################
    ####                             set yticks position
    #################################################################################
    axs[1].yaxis.set_ticks_position('right')  # axs[0].yaxis.tick_right()
    axs[0].set_xticks(x)
    axs[0].set_xticklabels(['J','F','M','A','M','J','J','A','S','O','N','D'],rotation=45)

    axs[0].set_ylabel('fig1_ylabel',c='r')
    axs[1].set_ylabel('fig2_ylabel',labelpad=-370,c='b')
    axs[2].set_ylabel('fig3_ylabel')
    axs[2].set_xlabel('Time : month')


    axs[0].tick_params(which='major',
                        direction='out',
                        bottom=False, left=True, right=True, top=True)
    axs[1].tick_params(which='major',
                        direction='out',
                        bottom=False, left=True, right=True, top=False)
    axs[2].tick_params(which='major',
                        direction='out',
                        bottom=True, left=True, right=True, top=False)

    from matplotlib.ticker import AutoMinorLocator, MultipleLocator
    axs[0].tick_params(which='minor',
                        direction='out',
                        colors='r')
    for i ,ax in enumerate(axs):
        print(i)
        ax.tick_params(which='both',
                            direction='out',
                            left=True, right=True,
                            width=2,
                            )
        ax.yaxis.set_minor_locator(AutoMinorLocator(5))

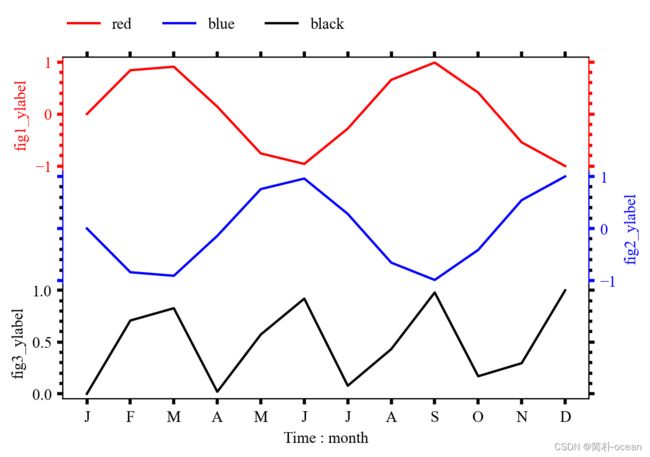
    fig.legend(['red','blue','black'],ncol=3,
               bbox_to_anchor=(0.56,1),frameon=False)
    plt.show()
if __name__=='__main__':

    print('drawing ')
    plot_line()
    # if i<2:
        # ax.spines['bottom'].set_color('none')
        # ax.tick_params(which='major',bottom=False)
        # ax.tick_params(axis='y',direction='out',length=4,)
# x = np.random.random(15)
# y = x

# axs[1].axis["right2"] = ax.new_fixed_axis(loc="right", offset=(20, 0))
# axs[1].axis["right2"].label.set_text("Label Y2")
此外,使用 fig.add_axes([])可以更灵活的设置子图的位置,这里就不展示了。代码中许多地方可以更简洁,使用循环或者封装的使得代码更简便,这里仅仅展示最基本的还原过程,欢迎大家分享更好更简单快捷的方法。
