plot python 作图 matplotlib
scatter 离散点制图
matplotlib.pyplot.scatter(x_axis_data, y_axis_data, s=None, c=None, marker=None, cmap=None, vmin=None, vmax=None, alpha=None, linewidths=None, edgecolors=None)
import matplotlib.pyplot as plt

# dataset-1
x1 = [89, 43, 36, 36, 95, 10,
    66, 34, 38, 20]

y1 = [21, 46, 3, 35, 67, 95,
    53, 72, 58, 10]

# dataset2
x2 = [26, 29, 48, 64, 6, 5,
    36, 66, 72, 40]

y2 = [26, 34, 90, 33, 38,
    20, 56, 2, 47, 15]

plt.scatter(x1, y1, c ="pink",
            linewidths = 2,
            marker ="s",
            edgecolor ="green",
            s = 50)

plt.scatter(x2, y2, c ="yellow",
            linewidths = 2,
            marker ="^",
            edgecolor ="red",
            s = 200)

plt.xlabel("X-axis")
plt.ylabel("Y-axis")
plt.show()

import numpy as np
import matplotlib.pyplot as plt

np.random.seed(19680801)


fig, ax = plt.subplots()
for color in ['tab:blue', 'tab:orange', 'tab:green']:
    n = 750
    x, y = np.random.rand(2, n)
    scale = 200.0 * np.random.rand(n)
    ax.scatter(x, y, c=color, s=scale, label=color,
               alpha=0.3, edgecolors='none')

ax.legend()
ax.grid(True)

plt.show()

volume = np.random.rayleigh(27, size=40)
amount = np.random.poisson(10, size=40)
ranking = np.random.normal(size=40)
price = np.random.uniform(1, 10, size=40)

fig, ax = plt.subplots()

# Because the price is much too small when being provided as size for ``s``,
# we normalize it to some useful point sizes, s=0.3*(price*3)**2
scatter = ax.scatter(volume, amount, c=ranking, s=0.3*(price*3)**2,
                     vmin=-3, vmax=3, cmap="Spectral")

# Produce a legend for the ranking (colors). Even though there are 40 different
# rankings, we only want to show 5 of them in the legend.
legend1 = ax.legend(*scatter.legend_elements(num=5),
                    loc="upper left", title="Ranking")
ax.add_artist(legend1)

# Produce a legend for the price (sizes). Because we want to show the prices
# in dollars, we use the *func* argument to supply the inverse of the function
# used to calculate the sizes from above. The *fmt* ensures to show the price
# in dollars. Note how we target at 5 elements here, but obtain only 4 in the
# created legend due to the automatic round prices that are chosen for us.
kw = dict(prop="sizes", num=5, color=scatter.cmap(0.7), fmt="$ {x:.2f}",
          func=lambda s: np.sqrt(s/.3)/3)
legend2 = ax.legend(*scatter.legend_elements(**kw),
                    loc="lower right", title="Price")

plt.show()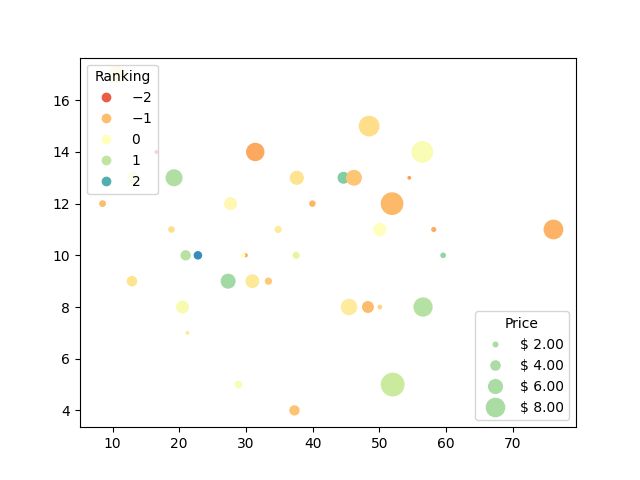
legend标签
import matplotlib.pyplot as plt
import numpy as np

plt.rcParams['font.sans-serif'] = ['SimHei']
plt.rcParams['axes.unicode_minus'] = False

n = np.linspace(-5, 4, 30)
m1 = 3 * n + 2
m2 = n ** 2

plt.xlabel('时间')
plt.ylabel('心情')

line1, = plt.plot(n, m1, color='r', linewidth=1.5, linestyle='-', label='女生购物欲望')
line2, = plt.plot(n, m2, 'b', label='男生购物欲望')

plt.legend(handles=[line1, line2], labels=['girl购物欲望','boy购物欲望'], loc='best')

plt.show()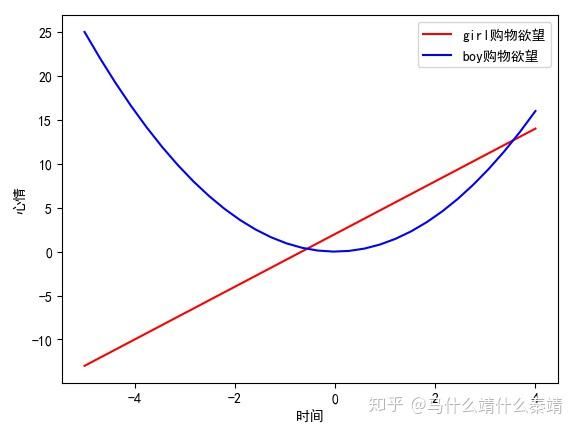
ref:
Scatter Plot
https://www.geeksforgeeks.org/matplotlib-pyplot-scatter-in-python/#:~:text=Scatter%20plots%20are%20used%20to%20observe%20relationship%20between,and%20how%20change%20in%20one%20affects%20the%20other.
https://matplotlib.org/stable/gallery/lines_bars_and_markers/scatter_with_legend.html#
matplotlib.org
https://matplotlib.org/stable/api/_as_gen/matplotlib.pyplot.xlabel.html