奇异值分解的原理、实现及应用
这是目录
- 定义
- 可视化
- 奇异值分解的python写法
- 应用
-
- 1.读取图片
- 2.奇异值分解
- 3.取前30个奇异值对图像重构
- 4.取前100个奇异值对图像重构
- 5.图片绘制
- 总结
定义
有一个 m × n m \times n m×n 的矩阵 A A A ,可以分解成如下形式
A = U Σ V T A = U \Sigma V^T A=UΣVT
其中 U ∈ R m × m U\in R^{m \times m} U∈Rm×m 和 V ∈ R n × n V\in R^{n \times n} V∈Rn×n 均为单位正交阵,即有 U U T = I UU^T=I UUT=I 和 V V T = I VV^T=I VVT=I ,U称为左奇异矩阵,V称为右奇异矩阵, Σ ∈ R m × n \Sigma \in R^{m \times n} Σ∈Rm×n 仅在主对角线上有值,称为奇异值。
可视化
可以用下面的图片表示奇异值分解的过程,图中方块的颜色表示值的大小,颜色越浅,值越大。对于奇异值矩阵 Σ \Sigma Σ ,只有其主对角线有奇异值,其余均为0。

#注:图片来自网络
奇异值分解的python写法
import numpy as np
A = np.array([[1,2,3],[4,5,6]])
print(A.shape)
print(A)
U,Sigma,VT = np.linalg.svd(A)
print(U)
print(Sigma)
print(VT)
应用
图片的压缩与重构
1.读取图片
import matplotlib.pyplot as plt
import matplotlib.image as mpimg
import numpy as np

img = mpimg.imread("lena.jpg")
print(img.shape)
2.奇异值分解
img_temp = img.reshape(img.shape[0],-1)
print(img_temp.shape)
U,Sigma,VT = np.linalg.svd(img_temp)
分解之后得到200个奇异值,从svd函数中得到的奇异值sigma的值是从大到小排列的,画出sigma的值的图像如下:
print(Sigma.shape)
plt.plot(Sigma)
plt.title('values of Sigma')
plt.show()
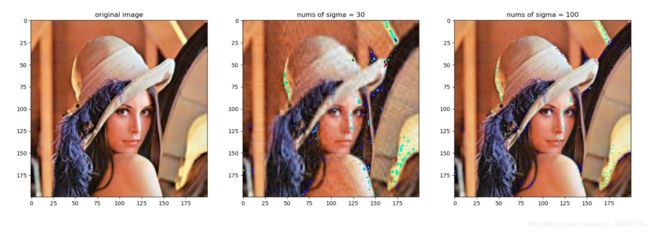
3.取前30个奇异值对图像重构
# 取前30个奇异值对图像重构
nums = 30
img_re1 = (U[:, 0:nums]).dot(np.diag(Sigma[0:nums])).dot(VT[0:nums, :])
print(img_re1.shape)
img_re1 = img_re1.reshape(200, 200, 3)
4.取前100个奇异值对图像重构
# 取前100个奇异值对图像重构
nums = 100
img_re2 = (U[:, 0:nums]).dot(np.diag(Sigma[0:nums])).dot(VT[0:nums, :])
img_re2 = img_re2.reshape(200, 200, 3)
5.图片绘制
fig, ax = plt.subplots(1, 3, figsize=(24, 32))
ax[0].imshow(img)
ax[0].set(title="original image")
ax[1].imshow(img_re1.astype(np.uint8))
ax[1].set(title="nums of sigma = 30")
ax[2].imshow(img_re2.astype(np.uint8))
ax[2].set(title="nums of sigma = 100")
plt.show()
总结
奇异值可以被看作成一个矩阵的代表值,或者说,奇异值能够代表这个矩阵的信息。当奇异值越大时,它代表的信息越多。因此,我们取前面若干个最大的奇异值,就可以基本上还原出数据本身。
从前面的曲线图可以看出,奇异值的大小下降是非常快的,因此可以只取前面几个奇异值,便可基本表达出原矩阵的信息。

