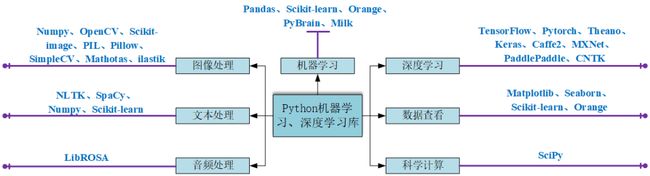
【python学习笔记】:数据科学库操作(二)
接上一篇:

4、PIL
Python Imaging Library(PIL) 已经成为 Python 事实上的图像处理标准库了,这是由于,PIL 功能非常强大,但API却非常简单易用。但是由于PIL仅支持到 Python 2.7,再加上年久失修,于是一群志愿者在 PIL 的基础上创建了兼容的版本,名字叫 Pillow,支持最新 Python 3.x,又加入了许多新特性,因此,我们可以跳过 PIL,直接安装使用 Pillow。
5、Pillow
使用 Pillow 生成字母验证码图片:
from PIL import Image, ImageDraw, ImageFont, ImageFilter

import random

# 随机字母:
def rndChar():
    return chr(random.randint(65, 90))

# 随机颜色1:
def rndColor():
    return (random.randint(64, 255), random.randint(64, 255), random.randint(64, 255))

# 随机颜色2:
def rndColor2():
    return (random.randint(32, 127), random.randint(32, 127), random.randint(32, 127))

# 240 x 60:
width = 60 * 6
height = 60 * 6
image = Image.new('RGB', (width, height), (255, 255, 255))
# 创建Font对象:
font = ImageFont.truetype('/usr/share/fonts/wps-office/simhei.ttf', 60)
# 创建Draw对象:
draw = ImageDraw.Draw(image)
# 填充每个像素:
for x in range(width):
    for y in range(height):
        draw.point((x, y), fill=rndColor())
# 输出文字:
for t in range(6):
    draw.text((60 * t + 10, 150), rndChar(), font=font, fill=rndColor2())
# 模糊:
image = image.filter(ImageFilter.BLUR)
image.save('code.jpg', 'jpeg')

验证码
6、SimpleCV
SimpleCV 是一个用于构建计算机视觉应用程序的开源框架。使用它,可以访问高性能的计算机视觉库,如 OpenCV,而不必首先了解位深度、文件格式、颜色空间、缓冲区管理、特征值或矩阵等术语。但其对于 Python3 的支持很差很差,在 Python3.7 中使用如下代码:
from SimpleCV import Image, Color, Display
# load an image from imgur
img = Image('http://i.imgur.com/lfAeZ4n.png')
# use a keypoint detector to find areas of interest
feats = img.findKeypoints()
# draw the list of keypoints
feats.draw(color=Color.RED)
# show the  resulting image.
img.show()
# apply the stuff we found to the image.
output = img.applyLayers()
# save the results.
output.save('juniperfeats.png')
会报如下错误,因此不建议在 Python3 中使用:
SyntaxError: Missing parentheses in call to 'print'. Did you mean print('unit test')?
7、Mahotas
Mahotas 是一个快速计算机视觉算法库,其构建在 Numpy 之上,目前拥有超过100种图像处理和计算机视觉功能,并在不断增长。使用 Mahotas 加载图像,并对像素进行操作:
import numpy as np
import mahotas
import mahotas.demos

from mahotas.thresholding import soft_threshold
from matplotlib import pyplot as plt
from os import path
f = mahotas.demos.load('lena', as_grey=True)
f = f[128:,128:]
plt.gray()
# Show the data:
print("Fraction of zeros in original image: {0}".format(np.mean(f==0)))
plt.imshow(f)
plt.show()

Mahotas
8、Ilastik
Ilastik 能够给用户提供良好的基于机器学习的生物信息图像分析服务,利用机器学习算法,轻松地分割,分类,跟踪和计数细胞或其他实验数据。大多数操作都是交互式的,并不需要机器学习专业知识。
9、Scikit-Learn
Scikit-learn 是针对 Python 编程语言的免费软件机器学习库。它具有各种分类,回归和聚类算法,包括支持向量机,随机森林,梯度提升,k均值和 DBSCAN 等多种机器学习算法。使用Scikit-learn实现KMeans算法:
import time

import numpy as np
import matplotlib.pyplot as plt

from sklearn.cluster import MiniBatchKMeans, KMeans
from sklearn.metrics.pairwise import pairwise_distances_argmin
from sklearn.datasets import make_blobs

# Generate sample data
np.random.seed(0)

batch_size = 45
centers = [[1, 1], [-1, -1], [1, -1]]
n_clusters = len(centers)
X, labels_true = make_blobs(n_samples=3000, centers=centers, cluster_std=0.7)

# Compute clustering with Means

k_means = KMeans(init='k-means++', n_clusters=3, n_init=10)
t0 = time.time()
k_means.fit(X)
t_batch = time.time() - t0

# Compute clustering with MiniBatchKMeans

mbk = MiniBatchKMeans(init='k-means++', n_clusters=3, batch_size=batch_size,
                      n_init=10, max_no_improvement=10, verbose=0)
t0 = time.time()
mbk.fit(X)
t_mini_batch = time.time() - t0

# Plot result
fig = plt.figure(figsize=(8, 3))
fig.subplots_adjust(left=0.02, right=0.98, bottom=0.05, top=0.9)
colors = ['#4EACC5', '#FF9C34', '#4E9A06']

# We want to have the same colors for the same cluster from the
# MiniBatchKMeans and the KMeans algorithm. Let's pair the cluster centers per
# closest one.
k_means_cluster_centers = k_means.cluster_centers_
order = pairwise_distances_argmin(k_means.cluster_centers_,
                                  mbk.cluster_centers_)
mbk_means_cluster_centers = mbk.cluster_centers_[order]

k_means_labels = pairwise_distances_argmin(X, k_means_cluster_centers)
mbk_means_labels = pairwise_distances_argmin(X, mbk_means_cluster_centers)

# KMeans
for k, col in zip(range(n_clusters), colors):
    my_members = k_means_labels == k
    cluster_center = k_means_cluster_centers[k]
    plt.plot(X[my_members, 0], X[my_members, 1], 'w',
            markerfacecolor=col, marker='.')
    plt.plot(cluster_center[0], cluster_center[1], 'o', markerfacecolor=col,
            markeredgecolor='k', markersize=6)
plt.title('KMeans')
plt.xticks(())
plt.yticks(())

plt.show()

KMeans
10、SciPy
SciPy 库提供了许多用户友好和高效的数值计算,如数值积分、插值、优化、线性代数等。SciPy 库定义了许多数学物理的特殊函数,包括椭圆函数、贝塞尔函数、伽马函数、贝塔函数、超几何函数、抛物线圆柱函数等等。
from scipy import special
import matplotlib.pyplot as plt
import numpy as np

def drumhead_height(n, k, distance, angle, t):
    kth_zero = special.jn_zeros(n, k)[-1]
    return np.cos(t) * np.cos(n*angle) * special.jn(n, distance*kth_zero)

theta = np.r_[0:2*np.pi:50j]
radius = np.r_[0:1:50j]
x = np.array([r * np.cos(theta) for r in radius])
y = np.array([r * np.sin(theta) for r in radius])
z = np.array([drumhead_height(1, 1, r, theta, 0.5) for r in radius])


fig = plt.figure()
ax = fig.add_axes(rect=(0, 0.05, 0.95, 0.95), projection='3d')
ax.plot_surface(x, y, z, rstride=1, cstride=1, cmap='RdBu_r', vmin=-0.5, vmax=0.5)
ax.set_xlabel('X')
ax.set_ylabel('Y')
ax.set_xticks(np.arange(-1, 1.1, 0.5))
ax.set_yticks(np.arange(-1, 1.1, 0.5))
ax.set_zlabel('Z')
plt.show()

SciPy
11、NLTK
NLTK 是构建Python程序以处理自然语言的库。它为50多个语料库和词汇资源(如 WordNet )提供了易于使用的接口,以及一套用于分类、分词、词干、标记、解析和语义推理的文本处理库、工业级自然语言处理 (Natural Language Processing, NLP) 库的包装器。NLTK被称为 “a wonderful tool for teaching, and working in, computational linguistics using Python”。
import nltk
from nltk.corpus import treebank

# 首次使用需要下载
nltk.download('punkt')
nltk.download('averaged_perceptron_tagger')
nltk.download('maxent_ne_chunker')
nltk.download('words')
nltk.download('treebank')

sentence = """At eight o'clock on Thursday morning Arthur didn't feel very good."""
# Tokenize
tokens = nltk.word_tokenize(sentence)
tagged = nltk.pos_tag(tokens)

# Identify named entities
entities = nltk.chunk.ne_chunk(tagged)

# Display a parse tree
t = treebank.parsed_sents('wsj_0001.mrg')[0]
t.draw()
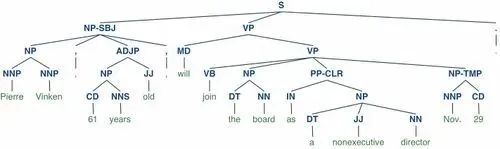
NLTK
12、spaCy
spaCy 是一个免费的开源库,用于 Python 中的高级 NLP。它可以用于构建处理大量文本的应用程序;也可以用来构建信息提取或自然语言理解系统,或者对文本进行预处理以进行深度学习。
  import spacy

  texts = [
      "Net income was $9.4 million compared to the prior year of $2.7 million.",
      "Revenue exceeded twelve billion dollars, with a loss of $1b.",
  ]

  nlp = spacy.load("en_core_web_sm")
  for doc in nlp.pipe(texts, disable=["tok2vec", "tagger", "parser", "attribute_ruler", "lemmatizer"]):
      # Do something with the doc here
      print([(ent.text, ent.label_) for ent in doc.ents])
nlp.pipe 生成 Doc 对象,因此我们可以对它们进行迭代并访问命名实体预测:
[('$9.4 million', 'MONEY'), ('the prior year', 'DATE'), ('$2.7 million', 'MONEY')]
[('twelve billion dollars', 'MONEY'), ('1b', 'MONEY')]
13、LibROSA
librosa 是一个用于音乐和音频分析的 Python 库,它提供了创建音乐信息检索系统所必需的功能和函数。
# Beat tracking example
import librosa

# 1. Get the file path to an included audio example
filename = librosa.example('nutcracker')

# 2. Load the audio as a waveform `y`
#    Store the sampling rate as `sr`
y, sr = librosa.load(filename)

# 3. Run the default beat tracker
tempo, beat_frames = librosa.beat.beat_track(y=y, sr=sr)
print('Estimated tempo: {:.2f} beats per minute'.format(tempo))

# 4. Convert the frame indices of beat events into timestamps
beat_times = librosa.frames_to_time(beat_frames, sr=sr)